- KPI – June 2026: State of Manufacturing
- KPI – June 2026: State of Business – Automotive Industry
- KPI – June 2026: State of the Economy
- KPI – June 2026: Consumer Trends
- KPI – June 2026: Recent Vehicle Recalls
In May, the Fiserv Small Business Index stayed stable at 144. Data shows small business sales rose 0.7% year-over-year, driven by average tickets that climbed 3.1% compared with 2025. Transactions declined 2.4% year-over-year, marking the seventh consecutive month of declining foot traffic. Compared with April, sales were flat and transactions declined slightly at 0.2%.
“We saw a continuation of recent trends in May: stable overall sales, rising average tickets and softer consumer activity as households adjust to increasing costs,” says Prasanna Dhore, chief data officer at Fiserv. “Services remained the strongest contributor to sales growth, full-service restaurants outperformed limited-service and higher fuel costs continued to impact many businesses.”
Key Takeaways, Courtesy of The Fiserv Small Business Sales Index:
- Restaurant sales continue to fight for growth: Sales declined 0.6% year-over-year but accelerated slightly month-over-month, at 0.6%. Higher prices continued to shape results, with average tickets up 3% year-over-year. Transactions fell 3.6%, marking a sixth consecutive month of year-over-year declines. Limited-Service Restaurants led the slowdown, with sales down 3.4% year-over-year and foot traffic falling 5.4%. Full-Service Restaurants showed relative strength, with sales up 1.5% year-over-year, supported by stable foot traffic (+0.2%) and modest average ticket growth (+1.3%).
- Elevated gasoline prices continue to impact multiple categories: Gas Station sales grew 22.9% year-over-year and 1.2% month-over-month, due entirely to higher average tickets. Rising fuel costs likely contributed to average ticket growth across multiple service segments, including Professional Services, Transportation and Warehousing and Administrative Support Services.
- Retail remained stable overall, with modest divergence between Core and Non-Core: Total retail sales increased 0.1% year-over-year but declined 0.5% month-over-month. Transactions were flat year-over-year and softened 0.6% compared to April. Core Retail sales were soft at 0.1% year-over-year and down 0.5% month-over-month. Retail transactions did not grow, but average tickets rose 0.9%. “Much of this reflects trade-offs consumers are making as retail essentials like gasoline have surged in price, driving consumers to find savings in other retail categories, such as Grocery, which fell 3.3% compared with 2025,” according to report details.
- Essentials continued to show steady growth: Sales increased 0.9% year-over-year, as average tickets rose 4.3%. Discretionary categories also expanded at 0.6% year-over-year, with average tickets up 2.6%. Transactions declined across both segments, though the pattern was consistent, indicating consumers are seeking to mitigate cost pressures wherever they can.
- Goods stabilize, while Services growth remains price-led: Goods sales edged up 0.1% year-over-year, with stable transactions and modest ticket growth up 0.2%. Services expanded 1% year-over-year, supported by 4.2% average ticket growth, while transactions declined 3.2% — a clear indication that price continues to drive overall sales growth.
The NFIB Small Business Optimism Index fell 0.6 points in May to 95.3, below its 52-year average of 98.0. Meanwhile, the Uncertainty Index rose three points from April to 91, well above its historical average of 68.
“AI investment spending has contributed to some excitement in the economy,” says Bill Dunkelberg, NFIB chief economist. “Despite the enthusiasm around AI, the overall picture is divided. More small business owners are struggling with significant and unpredictable hikes in fuel prices, which are more challenging for small businesses to pass on to their customers compared to their larger corporate competitors.”
Important Takeaways, Courtesy of NFIB:
- At 100.3, the Employment Index remained essentially flat in May. The current reading is below the 2025 average of 101.2 but slightly above the historical average of 100.0.
- Job openings and hiring plans fell notably to the lowest levels in six years. Approximately 29% (seasonally adjusted) of all owners reported job openings they could not fill in the current period, down five points from April and marking the lowest level since May 2020.
- A seasonally adjusted net 9% of owners plan to create new jobs in the next three months, down four points from April, also marking the lowest level since May 2020.
- 13% of small business owners cited labor quality as their single most important problem, down five points and marking the lowest level since December 2016.
- 14% of business owners reported labor costs as their single most important problem, up five points from April and the highest reading in the survey’s history.
- 16% (seasonally adjusted) of small business owners plan to make capital outlays in the next six months, down one point from April and the lowest level since March 2009.
- Reports of supply chain disruptions picked up in May, with a shift from those reporting no disruptions to those reporting mild or moderate disruptions. 70% of small business owners reported supply chain disruptions affecting their business to some extent, up six points from April.
- Reports of both actual and planned price increases rose significantly. The net percent of owners raising average selling prices rose six points from April to a net 36% (seasonally adjusted), marking the highest reading since March 2023. A net 34% (seasonally adjusted) plan to increase prices, up seven points from April and marking the highest reading since July 2022.
- 18% of business owners cited inflation as their single most important business problem, up two points from April and marking the highest reading since December 2024. Inflation ranks as the second top problem.
Professionals in the automotive, RV and powersports industries remain steadfast in their efforts to evolve their business models and grow their brands in the face of adversity. As such, the monthly Key Performance Indicator Report serves as an objective wellness check on the overall health of our nation, from the state of manufacturing and vehicle sales to current economic conditions and consumer trends. Below are a few key data points explained in further detail throughout the report.
Key Data Points:
- Economic activity in the manufacturing sector expanded in May for the fifth consecutive month, according to the nation’s supply executives in the latest ISM Manufacturing PMI Report. The Manufacturing PMI registered 54% in May, 1.3 percentage points higher than in April and its highest reading since May 2022 (55.9%). The overall economy continued in expansion for the 19th month in a row.
- In May, the global light vehicle (LV) selling rate was 89 million units per year, with year-to-date sales registering 35 million units — down over 4% compared to the first five months of 2025.
- Total new vehicle sales for May 2026, including retail and non-retail transactions, are projected to reach 1,490,900 — a 5.8% year-over-year increase, according to a joint forecast from JD Power and GlobalData.
- The Manheim Used Vehicle Value Index (MUVVI) increased to 213.9, reflecting a 0.6% increase in wholesale used-vehicle prices (adjusted for mix, mileage and seasonality) during the first 15 days of June compared to May. Wholesale values are now higher by 2.6% compared to June 2025, with appreciation trends slightly higher than the typical increase of 0.5% over the full month.
- Powersports Business says dealers across the country reported an incline of 6.4% in combined same-store sales compared to the same month last year, according to composite data from more than 1,700 dealerships in the U.S. that utilize CDK Lightspeed DMS. On average, dealerships were up 7% in major units, 2.2% in parts and 5.3% in service.
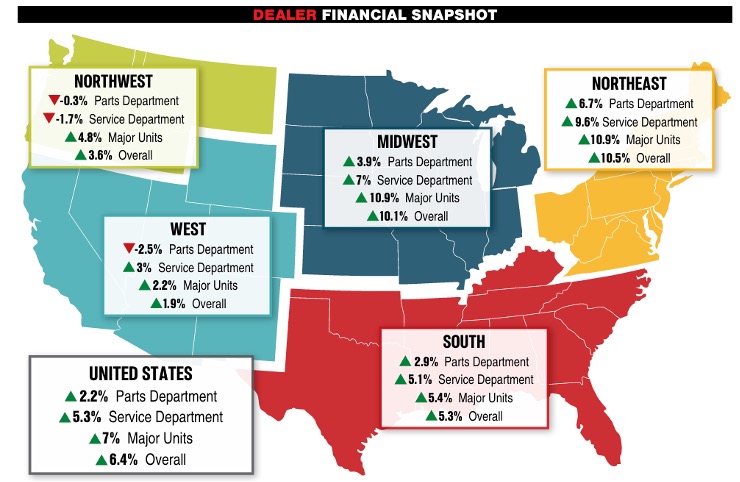 Image Source: Powersports Business