- KPI – June 2026: The Brief
- KPI – June 2026: State of Manufacturing
- KPI – June 2026: State of the Economy
- KPI – June 2026: Consumer Trends
- KPI – June 2026: Recent Vehicle Recalls
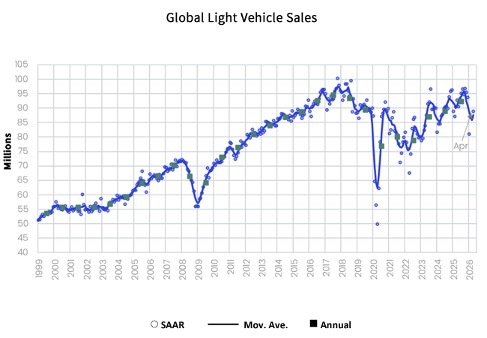
Global Light Vehicle Sales
In May, the global light vehicle (LV) selling rate was 89 million units per year, with year-to-date sales registering 35 million units – down over 4% compared to the first five months of 2025.
“Light vehicle sales remained subdued last month, as China’s market weakness continues to weigh on overall activity. Economic headwinds and reduced policy support effectiveness are hampering Chinese demand. In the U.S., the light vehicle market remains supported by high earners amid worsening macroeconomic conditions. Accelerating BEV sales and a broader selection of affordable vehicles are driving higher volumes in Western Europe, a region that continues to grow year-over-year,” according to report details.
Looking ahead, the Strait of Hormuz reopening should support global sales by easing supply-chain and energy cost pressures, though the outlook remains volatile unless maritime security is fully restored and the fragile ceasefire holds.
U.S. New Vehicle Market
Editor’s note: The data for the U.S. New Vehicle Market section and the Key Takeaways below have not yet been released for June. The information below is from the May KPI report. We will update this section as soon as the data is available.
Total new vehicle sales for May 2026, including retail and non-retail transactions, are projected to reach 1,490,900—a 5.8% year-over-year increase, according to a joint forecast from J.D. Power and GlobalData. Experts warn it is important to put the data in perspective, with annual comparisons being clouded by what happened a year ago when consumers reacted to the perceived risk of higher prices from vehicle tariffs.
“Sales in March and April of last year were inflated as consumers rushed to showrooms and pulled ahead their purchases. But by May, however, the pull-ahead had turned into payback, with an estimated 63,000 sales pulled out of May into the preceding months. This payback effect makes for a flattering year-over-year comparison, but in no way diminishes the impressive sales pace achieved. Retail volume is on pace to expand 6% to 1,231,900 units, even as buyers continue to navigate elevated payments and persistent affordability headwinds,” says Thomas King, president of the data and analytics division at J.D. Power.
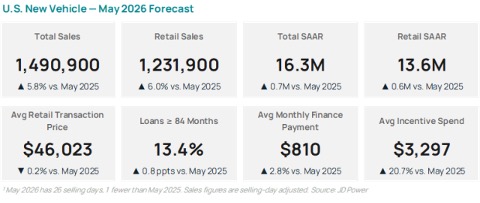
Key Takeaways, Courtesy of J.D. Power:
- Retail buyers are on pace to spend $53.8 billion on new vehicles, up $3.5 billion from a year ago.
- Trucks/SUVs account for 81.9% of new vehicle retail sales, up 1.8 percentage points year-over-year.
- Lease penetration continues to recover from the post-pandemic drought, with 22.6% of buyers opting to lease in May. This is up 0.3 percentage points from a year ago and provides OEMs with a useful tool to manage monthly payment challenges.
- The average new vehicle retail transaction price is expected to reach $45,462, up $649 from a year ago.
- Average incentive spending per vehicle is trending toward $3,297, a 20.7% year-over-year increase.
- Average monthly finance payments are on pace to be $748, up $21 from May 2024. The average interest rate for new-vehicle loans is expected to be 6.93%, down 0.10 percentage point from a year ago.
- Total retailer profit per unit—which includes vehicle gross plus finance and insurance income—is expected to be $2,502, up $98 from May 2024 but down $29 from April. Total aggregate retailer profit from new-vehicle sales for this month is projected to be $3 billion, up 9.8% from a year ago.
- Fleet sales are expected to total 254,069 units in May, down 7% from May 2024. Fleet volume is expected to account for 17.1% of total light-vehicle sales, down 1.2 percentage points from a year ago.
“Looking forward, the industry sales pace faces challenges on a number of fronts. For certain, sales pulled forward into March, April and May will become a meaningful headwind for the balance of the year,” King says. “Less certain are the challenges related to tariffs. The effect of tariffs on the general economy remains ambiguous but, directionally, pose a meaningful risk to vehicle demand.”
U.S. Used Market
The Manheim Used Vehicle Value Index (MUVVI) increased to 213.9, reflecting a 0.6% increase in wholesale used-vehicle prices (adjusted for mix, mileage and seasonality) during the first 15 days of June compared to May. Wholesale values are now higher by 2.6% compared to June 2025, with appreciation trends slightly higher than the typical increase of 0.5% over the full month.
“Manheim values continue their normal pattern of declining at this time of year, though prices are falling from elevated levels from stronger spring appreciation. The increase in the first half of June is very close to normal seasonal averages for the index, although non-seasonally adjusted prices show slightly higher rates of decay. Certain segments are performing better, as EV’s and compact cars continue to show stronger price appreciation, a sign that affordability may be doing some work behind the scenes,” says Jeremy Robb, chief economist at Cox Automotive.
While conflict in the Middle East appears to be nearing a solution, it is too early to know the impact in the rear-view mirror. With gas stockpiles low across the globe and prices at the pump over $4 per gallon in mid-June, experts expect energy demand to remain high and overall costs to plague consumers for some time.
“[In addition,] used retail days’ supply is a bit higher against last year, but the tariff impact in 2025 continued to drive demand through the summer. Current days’ supply is well balanced. As we move into the second half of the year, we should continue to see a ramp in both off-lease maturities and the rise of off-lease EV’s within that mix, two factors which are likely to influence the Manheim Index through year-end,” Robb says.
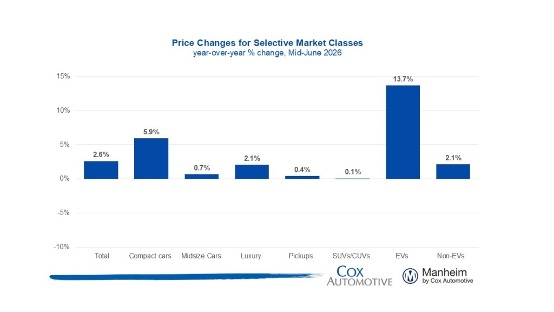
Click here to view results by segment.