
- KPI – June 2026: The Brief
- KPI – June 2026: State of Manufacturing
- KPI – June 2026: State of Business – Automotive Industry
- KPI – June 2026: Consumer Trends
- KPI – June 2026: Recent Vehicle Recalls
Employment
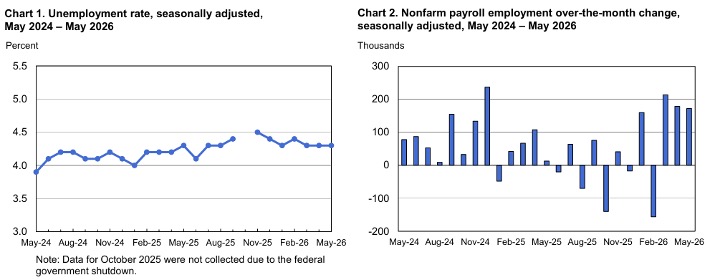
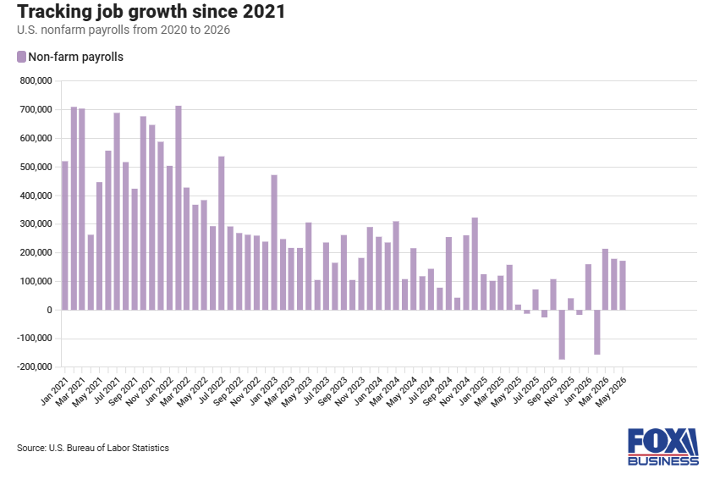
Total nonfarm payroll employment edged up by 172,000 in May — down slightly from the upwardly revised 179,000 in April but far above the Dow Jones consensus estimate for 80,000. Data shows the breadth of job gains improved this month, with multiple sectors posting solid advances, including leisure and hospitality, local government and health care. Employment in financial activities declined.
According to the U.S. Bureau of Labor Statistics, the unemployment rate and number of unemployed persons remained relatively unchanged at 4.3% and 7.3 million, respectively. The labor force participation rate held steady at 61.8%, with long-term unemployment accounting for 27.5%. A broader measure of unemployment, which includes discouraged workers and those holding part-time jobs for economic reasons, edged lower to 8.1%.
In addition, average hourly earnings rose 0.3% for the month and were up 3.4% over the past year, both in line with the Wall Street consensus.
“This is a labor market that is stronger than it was last year and is looking pretty darn solid, despite high energy prices and higher inflation generally,” says Gus Faucher, chief economist at PNC. “There’s no indication that the labor market needs support.”
According to CNBC reports, the above-consensus jobs numbers likely will deter the Federal Reserve from lowering interest rates anytime soon.
“More solid jobs data leaves the Fed where it’s been for a while — watching and waiting, focused on the inflation side of its mandate,” says Ellen Zentner, chief economic strategist at Morgan Stanley Wealth Management. “Rate cuts still aren’t on the near-term horizon, but the absence of inflationary threats in today’s report should quiet some of the chatter about a potential hike.”
By Demographic
This month, unemployment among the major worker groups: adult women – 3.8%; adult men – 4%; teenagers – 14.7%; Asians – 3.8%; Whites – 3.8%; Hispanics – 5%; and Blacks – 6.6%.
Last month, unemployment among the major worker groups: adult women – 3.9%; adult men – 4%; teenagers – 14.4%; Asians – 3.3%; Whites – 3.7%; Hispanics – 5%; and Blacks – 7.3%.
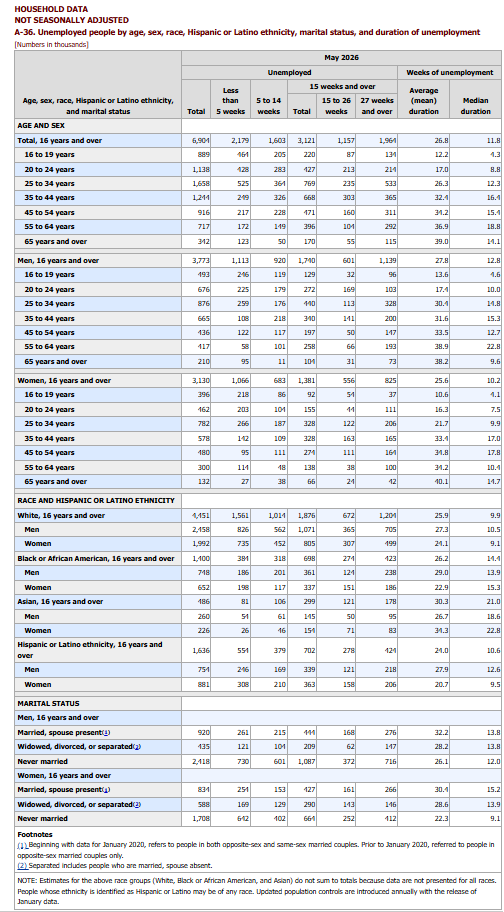 Image Source:
 By Industry
The Conference Board Employment Trends Index (ETI) decreased to 107.01 in May, down from an upwardly revised 107.88 in April.
“May’s payroll employment was strong, rising by 172,000 in the month. However, the ETI, a forward-looking measure for payrolls, ticked down slightly in May with 5 of 8 components contributing negatively to the index, highlighting potential downside risks to the labor market,” says Jannik Schulz, economic research associate, The Conference Board. “Nonetheless, the ETI is up 2.1 points compared to six months ago, indicating continued resilience in the labor market.”
May’s decrease in the ETI was a result of negative contributions from five of its eight components: The Percentage of Firms with Positions Not Able to Fill Right Now, Job Openings, Initial Claims for Unemployment Insurance, Real Manufacturing and Trade Sales, and Industrial Production. Three components contributed positively: The Ratio of Involuntarily Part-time to All Part-time Workers, the Percentage of Respondents Who Say They Find “Jobs Hard to Get,” and the Number of Employees Hired by the Temporary-Help Industry.
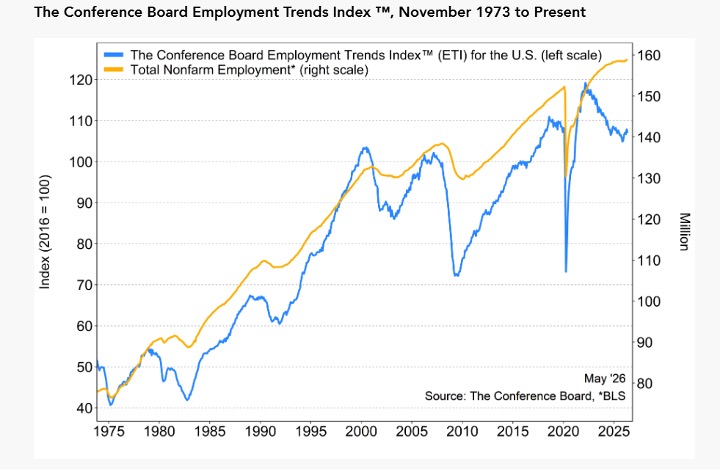 Caption: The Employment Trends Index is a leading composite index for payroll employment. When the Index increases, employment is likely to grow as well, and vice versa. Turning points in the Index indicate that a change in the trend of job gains or losses is about to occur in the coming months.
Key Takeaways, Courtesy of ETI:
- The primary drag on the ETI in May was the share of small firms reporting that jobs are “not able to be filled right now,” which dropped from 34% in April to 29% — the lowest level since May 2020.
- While Job Openings increased sharply, above 7.6 million in April, the jump was driven by an idiosyncratic movement in the professional and business service industry, which is not expected to continue.
- Initial claims for unemployment insurance increased to 214,800 in May, up from a historically low level in the previous month, but still down from one year ago.
- Real manufacturing and trade sales and Industrial production recorded little change but contributed marginally to the month’s decline.
- Positive contributions to the ETI included the share of involuntary part-time workers, which fell to 17.4% in May from 17.9% in April.
- The share of consumers who reported “jobs are hard to get” — an ETI component from the Consumer Confidence Survey — declined for a second month in a row to 18.6%, down from 19.4% in April.
- Employment in the temporary help services industry rose again and has been a positive contributor to the ETI all five months thus far in 2026, though the contribution was smaller in magnitude in May.
Click here to view more detailed information by industry.