- KPI – May 2026: State of Business – Automotive Industry
- KPI – May 2026: State of Manufacturing
- KPI – May 2026: State of the Economy
- KPI – May 2026: Consumer Trends
- KPI – May 2026: Recent Vehicle Recalls
In April, the Fiserv Small Business Index remained stable at 144. Small business sales rose 1.1% year-over-year, supported by higher average tickets, up 2.8%. This marked the largest year-over-year average ticket increase since 2022 and the fifth consecutive month with average tickets growing more than 2%. Transactions, also known as foot traffic, declined 1.7% year-over-year. On a monthly basis, both sales and transactions were flat compared to March.
“In April, small business spending remained resilient on the surface, but sales growth continued to be sustained by price-driven gains rather than increased demand,” says Prasanna Dhore, chief data officer at Fiserv. “As prices stay elevated, consumers are adjusting how they spend. They are visiting less often, prioritizing value and moderating nonessential categories—behaviors that sustain dollars spent while keeping overall foot traffic muted.”
Key Takeaways, Courtesy of the Fiserv Small Business Sales Index
- Restaurant sales declined 1.6% year-over-year and 0.2% month-over-month. Limited-Service Restaurants experienced notable declines, with sales down 4.8% year-over-year and foot traffic falling 5.1%, even as average tickets held steady. Full-Service Restaurants posted modest gains of 0.8% year-over-year and 0.2% month-over-month despite flat foot traffic and rising average tickets of 0.9% compared to 2025. These results reinforce a continuing shift to Full-Service dining as consumers become more selective amid fewer overall visits.
- Rising fuel costs appear to be impacting other high-frequency categories. Gas Station sales grew 4.4% month-over-month and 19% year-over-year, driven by higher average tickets. Rising fuel costs likely contributed to higher average tickets across service segments that are likely to pass gas-related costs on to consumers, including Professional Services (+9.8%), Transportation and Warehousing (+11.7%) and Administrative Support Services (+11.0%).
- Grocery spending softened, with sales and foot traffic both declining year-over-year at 2.3% and 0.8%, respectively. Similar caution appeared in Building Materials, where sales and transactions dropped 1.4% and 2.1%, respectively; though, year-over-year traffic was comparatively strong, up 3.6%.
- Essential category sales increased 1.9%, supported by average ticket growth of 3.5%. Discretionary sales rose 0.4%, even as average tickets increased 2.2%. Foot traffic declined at similar rates across both Essentials and Discretionary, down 1.6% and 1.8%, respectively.
- Goods and Services sales reflect divergent dynamics. Goods sales grew 0.2% year-over-year as foot traffic increased 0.9%, while average tickets declined 0.7% following strong prior-year demand. Services sales rose 1.5% year-over-year, driven by higher average tickets of 4.2%, even as transactions declined 1.7%.
At 95.9, the NFIB Small Business Optimism Index rose 0.1 point but remained below its 52-year average of 98.0 for the second consecutive month. The Uncertainty Index fell four points to 88, remaining well above its historical average of 68.
“Inflationary pressures continue to be a challenge for Main Street,” says Bill Dunkelberg, NFIB chief economist. “While small business optimism is currently fragile, the benefits of the Working Families Tax Cut Act should start to feed into the private sector over the next few months.”
Important Takeaways, Courtesy of NFIB
- The Employment Index fell from 101.6 in March to 100.4 in April. This is the second consecutive month of decline. The current reading is now below the 2025 average of 101.2 but still slightly above the historical average of 100.0.
- Reports of both actual and planned price increases rose. The net percent of owners raising average selling prices rose five points to a net 30% (seasonally adjusted), well above its historical average of net 13%. Looking forward to the next three months, a net 27% (seasonally adjusted) plan to increase prices, up three points from March.
- Approximately 18% of small business owners cited labor quality as their single most important problem, up three points from March and ranking as the top problem.
- A seasonally adjusted net negative 8% of all owners reported higher nominal sales in the past three months, down three points from March. Sales are weakening.
- The net percent of owners expecting higher real sales volumes over the next quarter fell four points from March to a net 3% (seasonally adjusted), the lowest reading in 12 months.
- The frequency of reports of positive profit trends rose six points from March to a net negative 19% (seasonally adjusted).
- A net 2% of owners reported paying a higher interest rate on their most recent loan, up five points.
- Approximately 22% of all owners reported borrowing regularly, down two points from March and the lowest level since November 2021.
- The net percent of owners expecting better business conditions fell seven points from March to a net 4% (seasonally adjusted). This was the fourth consecutive monthly decline in expected business conditions and the lowest level since October 2024.
- Approximately 7% (seasonally adjusted) reported that it is a good time to expand their business, down four points, and the lowest level since October 2024.
Key Data Points
- Economic activity in the manufacturing sector expanded in April for the fourth consecutive month, according to the nation’s supply executives in the latest ISM Manufacturing PMI Report. The Manufacturing PMI registered 52.7% in April, the same reading as March.
- In April, the global light vehicle (LV) selling rate improved to 89 million units per year but remained nearly 7% below the 92 million units per year recorded a year earlier. Overall, sales declined 3.4% year-over-year.
- Total new vehicle sales for May 2026, including retail and non-retail transactions, are projected to reach 1,490,900—a 5.8% year-over-year increase, according to a joint forecast from J.D. Power and GlobalData.
- Manheim Used Vehicle Value Index (MUVVI) increased to 213.1, reflecting a 0.5% increase in wholesale used-vehicle prices (adjusted for mix, mileage and seasonality) in the first 15 days of May compared to April, and a 3.8% increase compared to May 2025. Seasonally adjusted wholesale values typically increase by about 0.9% on average over the full month.
- Powersports Business says dealers across the country reported an incline of 3.9% in combined same-store sales compared to the same month last year, according to composite data from more than 1,700 dealerships in the U.S. that utilize CDK Lightspeed DMS. On average, dealerships were up 4% in major units, 1.8% in parts and 5.1% in service.
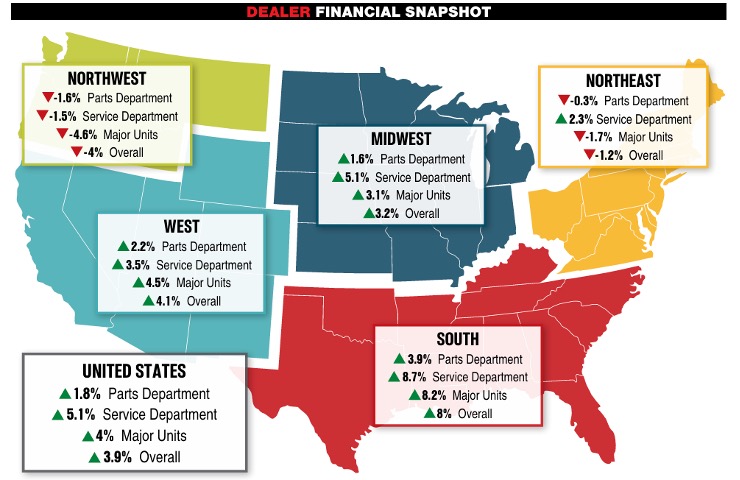
Image Source: Powersports Business