- KPI – May 2026: The Brief
- KPI – May 2026: State of Manufacturing
- KPI – May 2026: State of Business – Automotive Industry
- KPI – May 2026: State of the Economy
- KPI – May 2026: Recent Vehicle Recalls
Below is a synopsis of consumer sentiment, confidence, demand and income/spending trends.
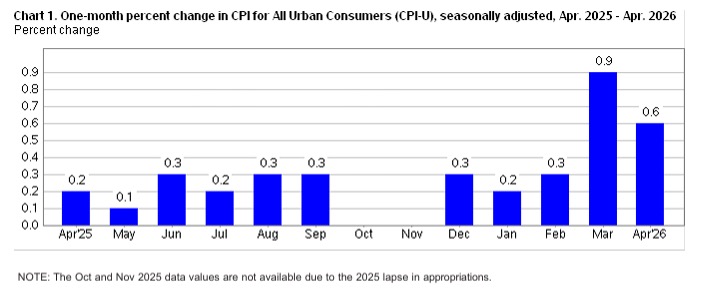
In April, the Consumer Price Index for All Urban Consumers (CPI-U) increased 0.6% on a seasonally adjusted basis after rising 0.9% a month prior, according to the U.S. Bureau of Labor Statistics. Over the last 12 months, the all-items index increased 3.8% before seasonal adjustment.
Most recently, the energy index rose 3.8% in April, accounting for over 40% of the monthly all-items increase. The shelter index increased as well, up 0.6%. The index for food increased 0.5% month-over-month, with the index for food-at-home and food-away-from-home inching up 0.7% and 0.2%, respectively.
The all-items-less-food-and-energy index increased 0.4%. Indexes on the rise include household furnishings and operations, airline fares, personal care, apparel and education, while new vehicles, communication and medical care decreased in April.
The all-items index increased to 3.8% for the 12 months ending April, after rising 3.3% for the 12 months ending March. The all-items-less-food-and-energy index rose 2.8% over the year, following a 2.6% increase over the 12 months ending March. The energy index jumped 17.9% for the 12 months ending April, while the food index increased 3.2% over the last year.
Sentiment
The University of Michigan Survey of Consumers—a survey consisting of approximately 50 core questions covering consumers’ assessments of their personal financial situation, buying attitudes and overall economic conditions—registered 49.8 in April and posted a preliminary reading of 44.8 in May.
“Consumer sentiment fell for the third straight month as supply disruptions in the Strait of Hormuz continue to boost gasoline prices. Sentiment is now just below the previous historical trough seen in June 2022. The cost of living continues to be a first-order concern, with 57% of consumers spontaneously mentioning that high prices were eroding their personal finances, up from 50% last month,” according to Joanne Hsu, director of Survey of Consumers.
Data shows lower-income consumers and those without college degrees posted particularly strong sentiment declines, as these groups are more sensitive to increases in the cost of gas and other essentials. Independents and Republicans posted decreases in sentiment, with both groups reaching their lowest readings of the current presidential administration. Meanwhile, sentiment of Democrats was little changed from last month.
“Critically, consumers appear worried that inflation will increase and proliferate beyond fuel prices, even in the long run,” Hsu says.
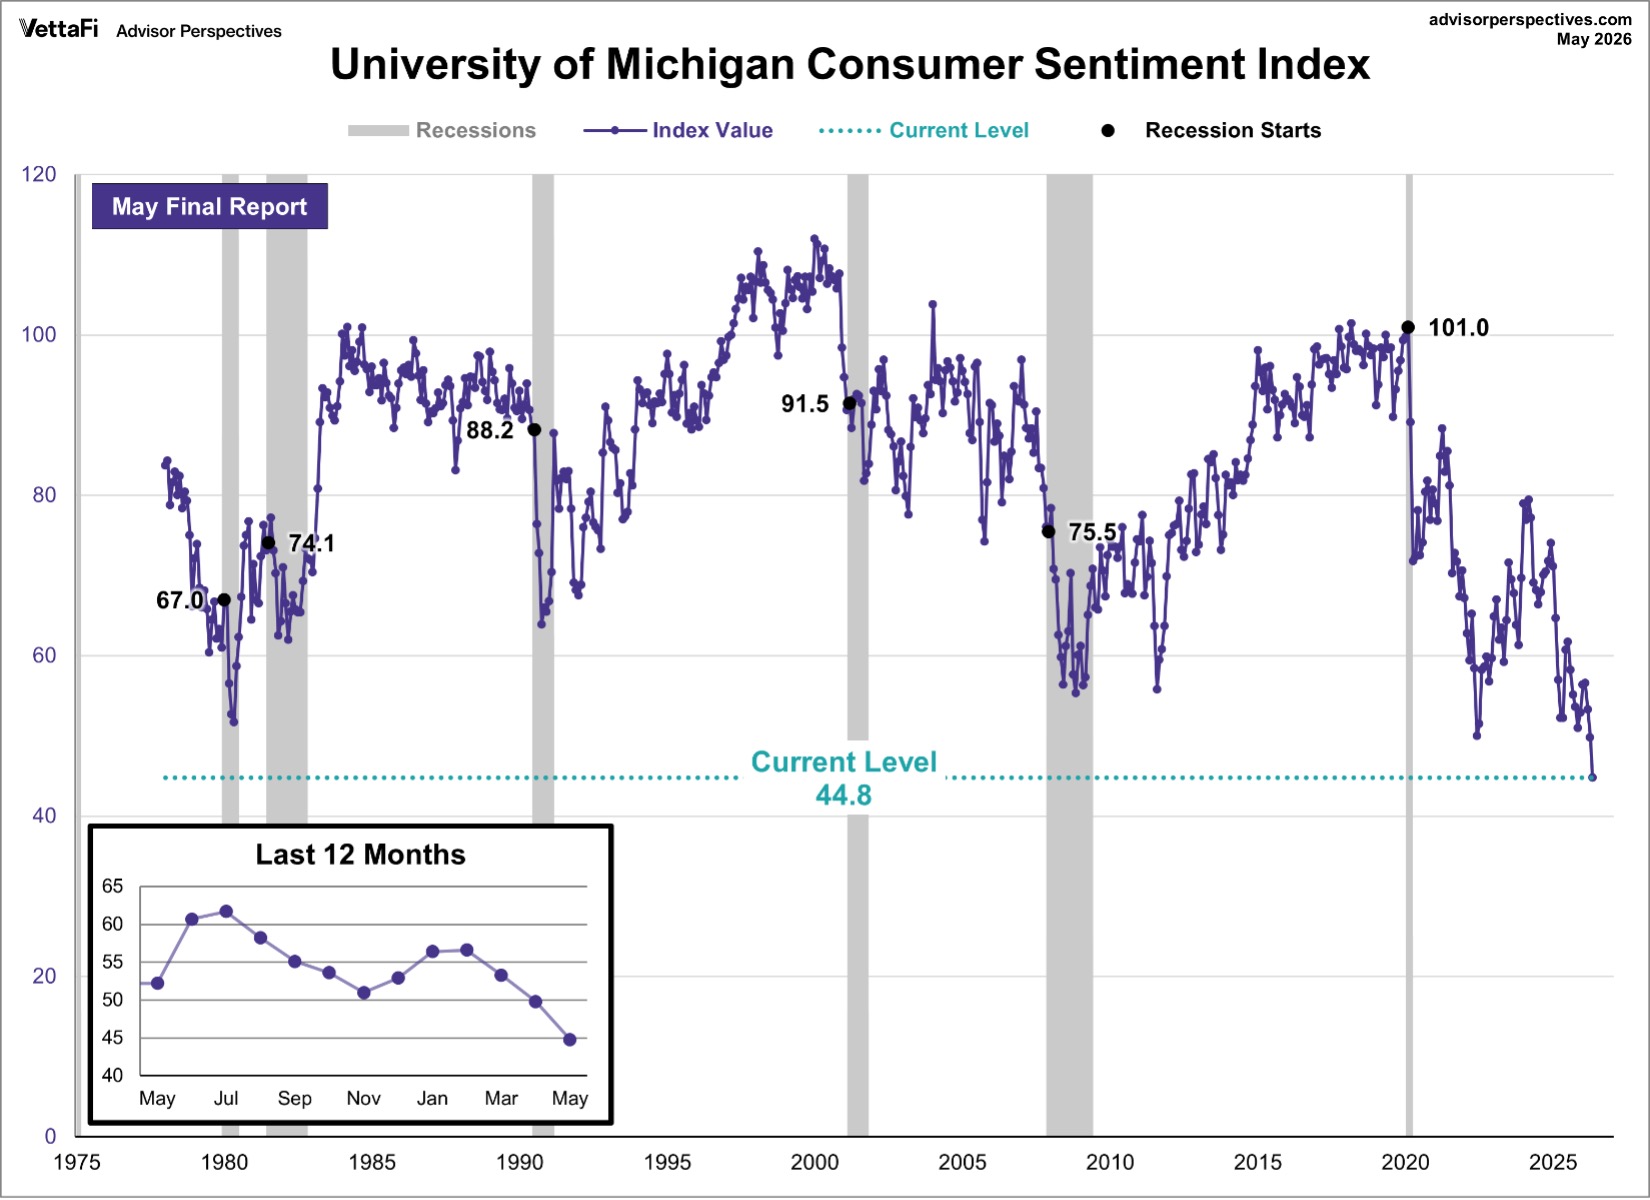
Caption: To put today’s report in historical context, consumer sentiment is currently 46.6% below its average reading of 83.9 (arithmetic mean) and 45.8% below its geometric mean of 82.6, based on data dating back to 1978.
Key Takeaways, Courtesy of Survey of Consumers
- Year-ahead inflation expectations inched up from 4.7% last month to 4.8% this month. The current reading substantially exceeds the 3.4% reading seen in February 2026 prior to the start of the Iran conflict, along with all 2024 readings.
- Long-run inflation expectations climbed from 3.5% in April to 3.9% in May, notably higher than the 2.8% to 3.2% range seen in 2024. This month’s increase in long-run expectations reflects sizable jumps among independents and Republicans. For the latter group, long-run inflation expectations are currently more than double their February 2025 reading on a monthly basis.
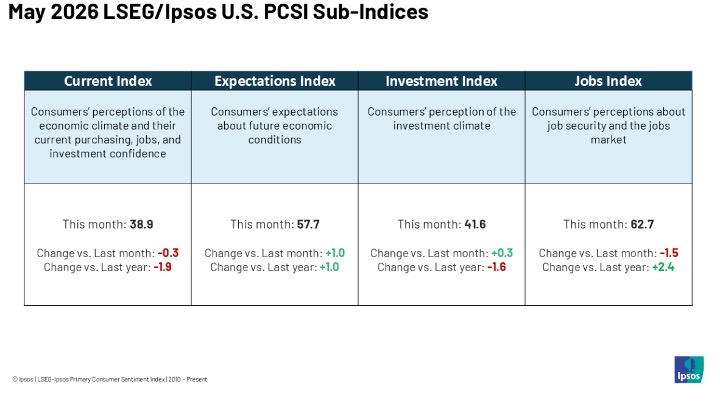
Caption: The LSEG/Ipsos Primary Consumer Sentiment Index for May 2026 registered 49.6. Fielded from April 24-30, 2026, the Index is stable (-0.3 point) from last month.
Confidence
The Conference Board Consumer Confidence Index dipped 0.7 points to 93.1 (1985=100) in May, down from an upwardly revised 93.8 in April. The Present Situation Index—based on consumers’ assessment of current business and labor market conditions—retreated by 3.2 points to 121.2. The Expectations Index—based on consumers’ short-term outlook for income, business and labor market conditions—rose to 74.4.
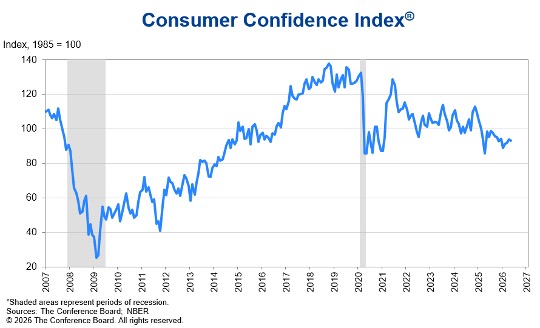
“Consumer confidence edged downward in May as the inflationary impacts of the war in the Middle East intensified. Consumer appraisals of current business conditions and the current labor market were moderately less positive compared to last month. This was somewhat offset by modest improvements in consumers’ expectations for business conditions and the labor market six months from now. Meanwhile, income expectations eased in May, as those anticipating less income rose,” says Dana M. Peterson, chief economist at The Conference Board.
Data shows confidence ticked up for consumers aged 35–54, but trended downward for older and younger consumers, both month-over-month and on a six-month moving average basis. Confidence among higher-income groups trended upward on a six-month moving average basis. By generation, confidence improved for the Silent Generation (the oldest group) but was little changed or lower among other generations. Republicans remained the most optimistic, while Independents were the only group that saw confidence tick up on a month-over-month basis.
Key Takeaways, Courtesy of The Conference Board
- Consumers’ net views of their Family’s Current Financial Situation and Family’s Future Financial Situation were both somewhat less positive in May.
- The share of consumers who said a U.S. recession is “very likely” and “somewhat likely” over the next 12 months increased. Those saying recession is “not likely” declined.
- Consumers’ average and median 12-month inflation expectations ticked downward but remained elevated. The percentage of consumers saying interest rates over the next 12 months will be higher on net stood at nearly 50% in May.
- The ongoing stock market rally—largely fueled by the tech sector and rising hopes for an end to the Middle East conflict—likely influenced consumer expectations of higher stock prices a year from now.
- Consumers’ plans to buy big-ticket items over the next six months continued to shift from “yes” to “no” in May. Nonetheless, the proportion saying “yes” remained well above the other responses. Buying plans for autos continued to rise on a six-month moving average basis, with used cars remaining the clear preference over new cars. Homebuying expectations inched higher, as plans to buy existing homes rose, offsetting a small dip in newly-built units. Spending plans for white goods, home furnishings and electronics eased a tad or were unchanged on a six-month moving average basis.
- Consumers planning more spending on services over the next six months shifted from “yes” and “maybe” to “no” in May. Future spending plans on services were mixed. Consumer spending trends in 2026 remained focused on “cheap thrills” and necessary services, but there was some increase in demand for discretionary services like personal travel, fitness, amusement parks and gambling. Among all service categories, restaurants/bars/take-out, streaming/internet/mobile services, as well as beauty and personal care, remained among the top three spending targets.
- Travel intentions for six months ahead ticked up in May, with consumers favoring domestic destinations over international travel. Overall expected spending on hotel/motel and airfare/trains for personal travel increased in May, correlating with an uptick in vacation plans.
“Consumers’ write-in responses on factors affecting the economy continued to skew towards pessimism. References to prices and oil and gas increased in frequency for a second consecutive month, while mentions of war, geopolitics and conflict remained elevated—likely signaling consumers’ underlying concerns about the inflationary impacts of the war in the Middle East on their wallets,” Peterson says.
Consumer Income & Spending
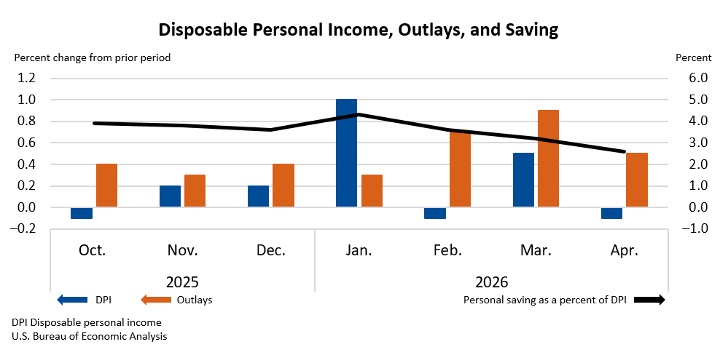
Personal income decreased by less than $0.1 billion (0.1% at a monthly rate) in April, according to the U.S. Bureau of Economic Analysis (BEA). Disposable personal income (DPI)—personal income less personal current taxes—decreased $19.9 billion (0.1%), while personal consumption expenditures (PCE) increased $111.1 billion (0.5%).
Personal outlays—the sum of PCE, personal interest payments and personal current transfer payments—increased $114.0 billion in April. Personal saving was $611.7 billion, and the personal saving rate—personal saving as a percentage of DPI—registered 2.6%.
The decrease in current-dollar personal income primarily reflected a decrease in farm proprietors’ income that was partly offset by an increase in compensation. The $111.1 billion increase in current-dollar PCE reflected increases of $67.2 billion in spending on services and $44 billion in spending on goods.
Key Takeaways, Courtesy of the U.S. Bureau of Economic Analysis
- In April, Real PCE increased $18.1 billion (0.1% at a monthly rate).
- The PCE price index increased 0.4% month-over-month. Excluding food and energy, the PCE price index increased 0.2%.
- The PCE price index increased 3.8% year-over-year. Excluding food and energy, the PCE price index increased 3.3% from one year ago.