- KPI – April 2026: State of Business – Automotive Industry
- KPI – April 2026: State of Manufacturing
- KPI – April 2026: State of the Economy
- KPI – April 2026: Consumer Trends
- KPI – April 2026: Recent Vehicle Recalls
In March, the Fiserv Small Business Index reached 144.1, posting year-over-year growth of 1.3% and a month-over-month increase of 0.7%. The Fiserv Small Business Transaction Index held at 102.7, with transactions falling 1.3% year-over-year but improving 0.5% month-over-month. According to the report, these results highlight steady sales growth despite weaker transaction activity. The Real Fiserv Small Business Index, adjusted for inflation, stood at 109.9—registering 1.9% year-over-year and.4% month-over-month declines.
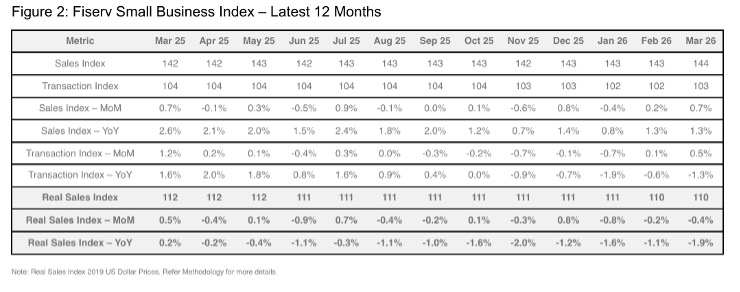
Key Takeaways, Courtesy of The Fiserv Small Business Sales Index:
- March remained in line with February’s sales growth pace, up 1.3% year-over-year despite annual transactions (foot traffic) declining 1.3%. Sales growth was sustained by average ticket growth of 2.6%. Month-over-month sales (+0.7%) and foot traffic (+0.5%) accelerated from February, signaling increased activity and relatively stable month-over-month average tickets. Seasonal demand drove strong month-over-month growth in Building Materials and Garden Equipment, Accommodations (Hotels) and Specialty Trade Contractors. Gasoline Stations and Fuel Dealers posted 10.3% sales growth and 3.1% transaction growth as crude oil prices spiked amid geopolitical disruptions. Food Service was up a nominal 0.2% month-over-month, while Food & Beverage sales declined 0.5%, as consumers traded down on basket mix.
- The geopolitical disruption that dominated the month pushed Gasoline Stations’ month-over-month sales growth higher, up 10.3%, driven primarily by a jump in average tickets of 7.2%. Year-over-year sales growth of 12.7% was driven entirely by the jump in average tickets, up 12.9%. Consumers may have partially offset this year-over-year increase by moderating spend at Food Services and Drinking Places, down 1% year-over-year. Limited-service restaurants saw sales decline 2.9% year-over-year in March, as foot traffic eroded 4.2%. Full-service restaurant sales were less affected, up 0.4% year-over-year, but foot traffic was challenged there as well, down 0.3% year-over-year. Food and Beverage Retailers also experienced declines year-over-year (-1.5%) and month-over-month (-0.5%).
- Retail was up 1.2% month-over-month, with year-over-year sales growth more moderate at 0.7%. Most of the month-over-month growth came from Gasoline Stations, up 10.3%. Building Materials (+3.5%), Motor Vehicle Parts (+1.6%) and Furniture (+1.7%) also contributed, with acceleration in these subsectors driven by increased foot traffic rather than average ticket growth. Food and Beverage Stores (-0.5% month-over-month, -1.5% year-over-year) saw sales decline due to more budget-conscious consumer selections and lower foot traffic.
- Consumers appeared to be resolved to higher average tickets at Gasoline Stations (+12.9% year-over-year), as transactions accelerated from February (+3.1% MoM) and were almost flat year-over-year (-0.2%). This reflects broader sales growth for discretionary subsectors (+0.8% YoY, +0.8% MoM), as well as essential subsectors (+1.9% YoY, +0.6% MoM). This pattern of essential outpacing discretionary sales growth has continued for 12 consecutive months.
At 95.8, the NFIB Small Business Optimism Index fell three points in March, registering below its 52-year average of 98 for the first time since April 2025. The Uncertainty Index rose four points to 92, well above its historical average of 68.
“The 20% Small Business Deduction and other supportive small business tax provisions in the Working Families Tax Cut Act have had many positives for small business owners,” says Bill Dunkelberg, NFIB chief economist. “However, the dramatic spike in oil prices has spooked consumers and owners alike. Small business owners are having to absorb those higher input costs and pass them along to their customers.”
Important Takeaways, Courtesy of NFIB:
- Positive profit trends fell 11 points to a net negative 25% (seasonally adjusted), contributing the most to the Optimism Index’s decline.
- The net percent of owners expecting better business conditions fell seven points to a net 11% (seasonally adjusted), the third consecutive monthly decline and the lowest level since October 2024. This was the second biggest contributor to the Index’s decline.
- The Employment Index fell in March from 103.5 to 101.6. While the 1.9-point decline is a meaningful turn in labor market conditions, the current reading remains above both the 2025 average of 101.2 and the historical average of 100.
- Both planned and actual labor compensation decreased from the previous month. A seasonally adjusted net 33% reported raising compensation, down one point from February. A seasonally adjusted net 18% plan to raise compensation in the next three months, down four points from February and the lowest reading since July 2025.
- Sixteen percent (seasonally adjusted) of small business owners plan to make capital outlays in the next six months, down two points from February and the lowest level since November 2009.
- A seasonally adjusted net negative 5% of all owners reported higher nominal sales in the past three months, down six points from February. This decline ended a string of four consecutive months of improvement.
- A net negative 5% (seasonally adjusted) of owners plan inventory investment in the coming months, down three points and the lowest level since May 2024. This aligns with the decline in those expecting higher sales over the next quarter.
- Sixty-two percent of small business owners reported that supply chain disruptions affected their business to some extent, up three points. Three percent reported a significant impact (down two points), 17% reported a moderate impact (up three points), 42% reported a mild impact (up two points) and 36% reported no impact (down three points).
- Actual price increases picked up following three consecutive months of decline. The net percent of owners raising average selling prices rose one point to a net 25% (seasonally adjusted), well above its historical average.
- In contrast to actual prices, planned prices declined, falling four points to a net 24% (seasonally adjusted)—the lowest level since July 2024.
- When asked to evaluate the overall health of their business, 13% rated it as excellent (up one point), 51% as good (down four points), 30% as fair (up four points) and 4% as poor (down one point).
Purpose of the Monthly Key Performance Indicator Report
Professionals in the automotive, RV and powersports industries remain steadfast in their efforts to evolve their business models and grow their brands in the face of adversity. As such, the monthly Key Performance Indicator Report serves as an objective wellness check on the overall health of our nation, from the state of manufacturing and vehicle sales to current economic conditions and consumer trends. Below are a few key data points explained in further detail throughout the report.
Key Data Points:
- Economic activity in the manufacturing sector expanded in March for the third consecutive month, say the nation’s supply executives in the latest ISM Manufacturing PMI Report. The Manufacturing PMI registered 52.7% in March, a 0.3-percentage point increase compared to the reading of 52.4% in February. The overall economy continued to expand for the 17th month in a row.
- In March, the Global Light Vehicle (LV) selling rate improved to more than 87 million units per year, despite overall sales decreasing by 3.5% year-over-year.
- [Editor’s Note: We are still waiting on the updated data for new vehicle sales. We will update this information as soon as we have the new data.] Total new vehicle sales for March 2026, including retail and non-retail transactions, are projected to reach 1,372,877, a 11.4% decrease year-over-year and a 11.9% increase from February 2026, according to a joint forecast from JD Power and GlobalData.
- Powersports Business says dealers across the country reported an incline of 8.7% in combined same-store sales compared to the same month last year, according to composite data from more than 1,700 dealerships in the U.S. that utilize CDK Lightspeed DMS. On average, dealerships were up 9.9% in major units, 0.8% in parts and 6.4% in service.
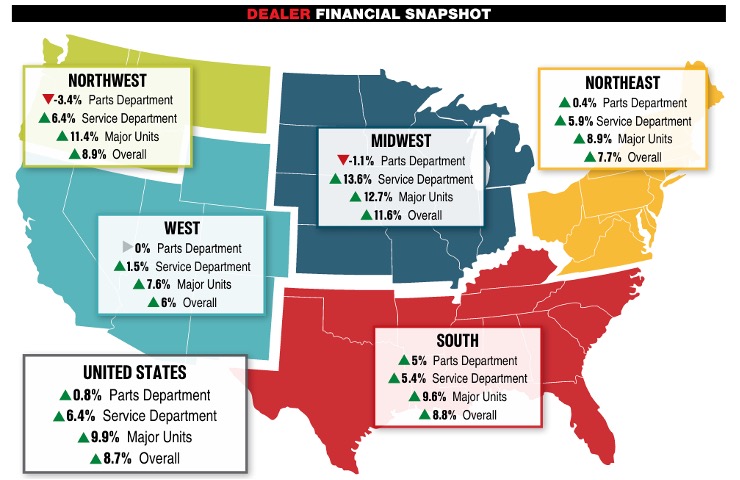 Image Source: Powersports Business