KPI – April 2026: State of Business – Automotive Industry
Sponsored by Turn 14 Distribution
- KPI – April 2026: The Brief
- KPI – April 2026: State of Manufacturing
- KPI – April 2026: State of the Economy
- KPI – April 2026: Consumer Trends
- KPI – April 2026: Recent Vehicle Recalls
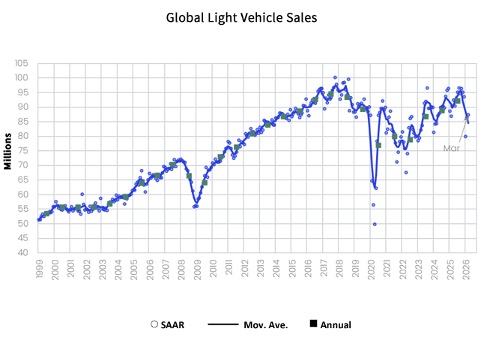
Global Light Vehicle Sales
In March, the Global Light Vehicle (LV) selling rate improved to more than 87 million units per year, despite overall sales decreasing by 3.5% year-over-year.
According to GlobalData, it was another disappointing month, as continued weakness in the U.S. and China weighed on overall growth. Sales remain under pressure in China due to soft consumer confidence and the gradual unwinding of prior NEV incentives. In the U.S., sales were up against a high base last year, when buyers accelerated purchases ahead of tariffs.
Looking ahead, with the outlook for a resolution to the Middle East conflict still uncertain, GlobalData expects the global LV market to face further headwinds in H2 2026 as consumers begin to feel the impact of higher energy prices.
U.S. New Vehicle Market
Editor’s note: The data for the U.S. New Vehicle Market section and the Key Takeaways below have not yet been released for April. The information below is from the March KPI report. We will update this section as soon as the data is available.
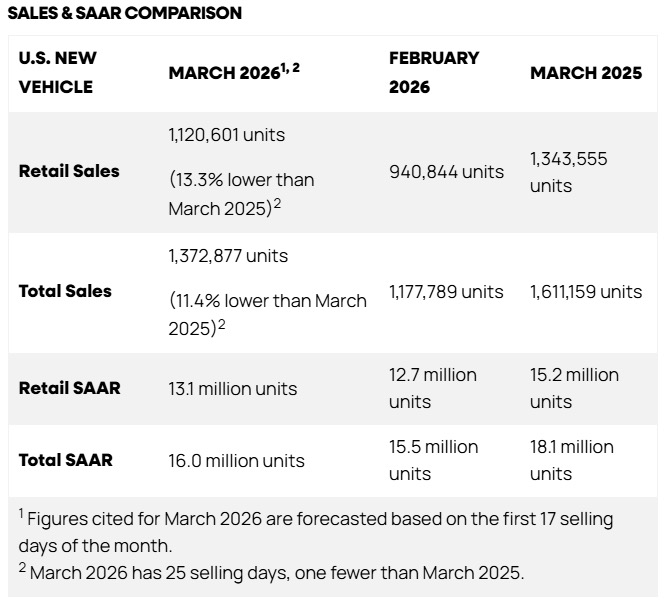
Total new-vehicle sales for March 2026, including retail and non-retail transactions, are projected to reach 1,372,877, a 11.4% decrease year-over-year, and a 11.9% increase from February 2026, according to a joint forecast from JD Power and GlobalData.
In March, vehicle sales are on pace to deliver the best monthly performance of the year, with total sales expected to reach 16 million units on an annualized basis. However, year-over-year data presents a far less positive picture, with total sales down 11.4%, and retail sales down 13.3%. According to JD Power, the apparent contradiction is really a technical anomaly.
“March 2025 sales were inflated by consumers who rushed to showrooms in anticipation of a big increase in vehicle prices due to tariffs. In fact, the rush to showrooms last March resulted in a total annualized sales pace of 18.1 million, the highest of any month in 2025 and well above the full-year sales pace of 16.3 million. Said differently, the usual focus on year-over-year sales changes is not helpful in understanding the underlying health of consumer demand for new vehicles this month,” says Thomas King, president of the data and analytics division at J.D. Power.
“Putting aside last year’s results, March 2026 shows continued strong demand for new vehicles, despite concerns around fuel prices and economic uncertainty. In fact, March results would have been even stronger were it not for unusually low availability of one of the industry’s best-selling vehicles,” he says.
Furthermore, King points to the elimination of Federal Electric Vehicle credits as a challenge the industry continues to face. Now, consumers interested in EV purchases inevitably face higher prices.
Key Takeaways, Courtesy of J.D. Power:
- Retail buyers are on pace to spend $49.4 billion on new vehicles, down $8 billion year-over-year.
- Leasing is expected to account for 22.9% of sales this month, down 0.5 percentage points from a year ago.
- The average new vehicle retail transaction price is expected to reach $45,859, up $1,102 year-over-year.
- Average monthly finance payments are on pace to be $805, up $38 from a year ago.
- For retailers, profit per unit—which includes vehicle gross plus finance and insurance income—is expected to be $2,452, up $26 year-over-year and up $80 from a month prior. Total aggregate retailer profit from new-vehicle sales for this month is projected to be $2.6 billion, down 15.1% from last year, with decline driven by last year’s inflated sales pace.
- Fleet sales are expected to total 252,276 units in March, down 2% year-over-year. Fleet volume is expected to account for 18.4% of total light-vehicle sales, up 1.8 percentage points from a year ago.
“Looking ahead, interpreting year-over-year results will remain unusually challenging for most of the year, as the industry continues to work through the after-effects of two major pull-ahead events in 2025. The first was the tariff-driven rush to showrooms in March and April, when approximately 173,000 additional purchases were pulled forward, followed by a payback period that weighed on subsequent months. The second was the EV pull-ahead ahead of the Sept. 30 expiration of federal EV tax credits, which temporarily inflated EV demand in late summer before shifting to a payback dynamic that persisted into the fall,” King says.
“As a result, simple year-over-year comparisons will remain inherently noisy—reflecting the timing of these events more than underlying demand—until the industry fully laps both events. In practical terms, it will most likely be late in the year before comparisons return to a more normalized pattern and provide a clearer read on market momentum,” he continues.
U.S. Used Market
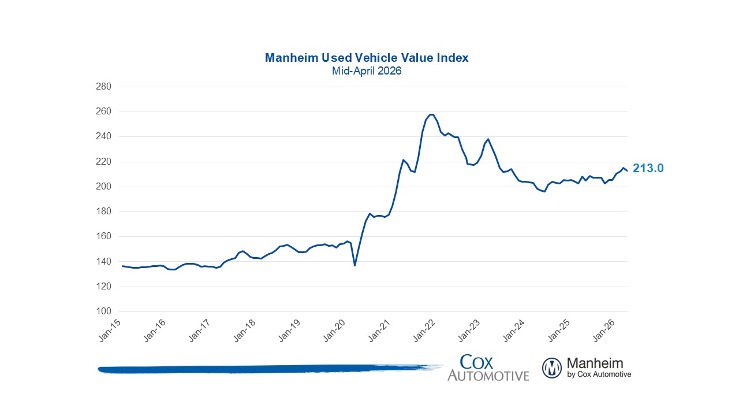
The Manheim Used Vehicle Value Index (MUVVI) dipped to 213.0—reflecting a 1.1% decrease in wholesale used-vehicle prices (adjusted for mix, mileage and seasonality) in the first 15 days of April but a 2.3% increase year-over-year.
“The spring bounce can shift from year to year depending on where dealers’ inventory levels are at the start of the year and the strength of tax refund season. We started 2026 off hot in the wholesale market, with our MMR retention index increasing every single week during Q1 and ending the quarter much stronger than normal. As we enter April, wholesale prices are still rising but at much more normal levels relative to long-term averages,” says Jeremy Robb, chief economist at Cox Automotive.
While seasonal factors added volatility, the market has been strong “any way you cut it,” he says. Combined, March and April, seasonally adjusted MUVVI values are up 4.5% against last year. “Well above what we’d normally expect for this time of year, and the month isn’t over yet,” Robb explains.
In addition, gas prices remain above $4 per gallon, and used EV values show higher appreciation than non-EV values. “It’s going to be an interesting year observing the valuations and sales pace of used EVs as the market sniffs out consumer demand elasticity with the fluctuations in gas prices,” he says.
Click here to view results by segment.