- KPI – April 2026: The Brief
- KPI – April 2026: State of Manufacturing
- KPI – April 2026: State of Business – Automotive Industry
- KPI – April 2026: State of the Economy
- KPI – April 2026: Recent Vehicle Recalls
Below is a synopsis of consumer sentiment, confidence, demand and income/spending trends.
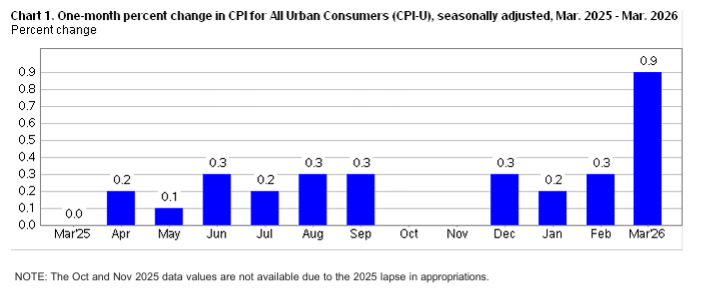
In March, the Consumer Price Index for All Urban Consumers (CPI-U) increased 0.9% on a seasonally-adjusted basis after rising 0.3% in February, according to the U.S. Bureau of Labor Statistics. Over the last 12 months, the all-items index increased 3.3% before seasonal adjustment.
Most recently, the energy index rose 10.9%, led by a 21.2% increase in the gasoline index, which accounted for nearly three-quarters of the monthly all-items increase. The shelter index also increased in March, rising 0.3%. The index for food was unchanged month-over-month, as the index for food-away-from-home rose 0.2%, while the index for food-at-home fell 0.2%.
The index for all-items-less-food-and-energy rose 0.2% in March. Although airline fares, apparel, household furnishings and operations, education and new vehicles were on the rise, indexes like medical care, personal care and used cars and trucks decreased in March.
The all-items index rose 3.3% year-over-year in March, compared to 2.4% over the 12 months ending February. The all-items-less-food-and-energy index rose 2.6% year-over-year, following a 2.5% increase over the 12 months ending February. The energy index increased 12.5% over the last year, while the food index increased 2.7%.
Sentiment
The University of Michigan Survey of Consumers—a survey consisting of approximately 50 core questions covering consumers’ assessments of their personal financial situation, buying attitudes and overall economic conditions—registered 53.3 in March and posted a preliminary reading of 47.6 in April.
“Consumer sentiment sank about 11% this month, extending a decline that began with the start of the Iran conflict, and is currently about 9% below a year ago,” according to Joanne Hsu, director of Survey of Consumers.
Data shows demographic groups across age, income and political party all posted setbacks in sentiment, as did every component of the index. One-year expected business conditions plunged approximately 20%, now 6% below last April. Assessments of personal finances declined 11%, with consumers expressing a substantial increase in concerns over high prices and weaker asset values.
“Buying conditions for durables and vehicles worsened, again on the basis of high prices. Open-ended comments show that many consumers blame the Iran conflict for unfavorable changes to the economy. Note that 98% of interviews were completed prior to the April 7th announcement of a temporary cease-fire. Economic expectations will likely improve after consumers gain confidence that the supply disruptions stemming from the Iran conflict have ended and gas prices have moderated,” she says.
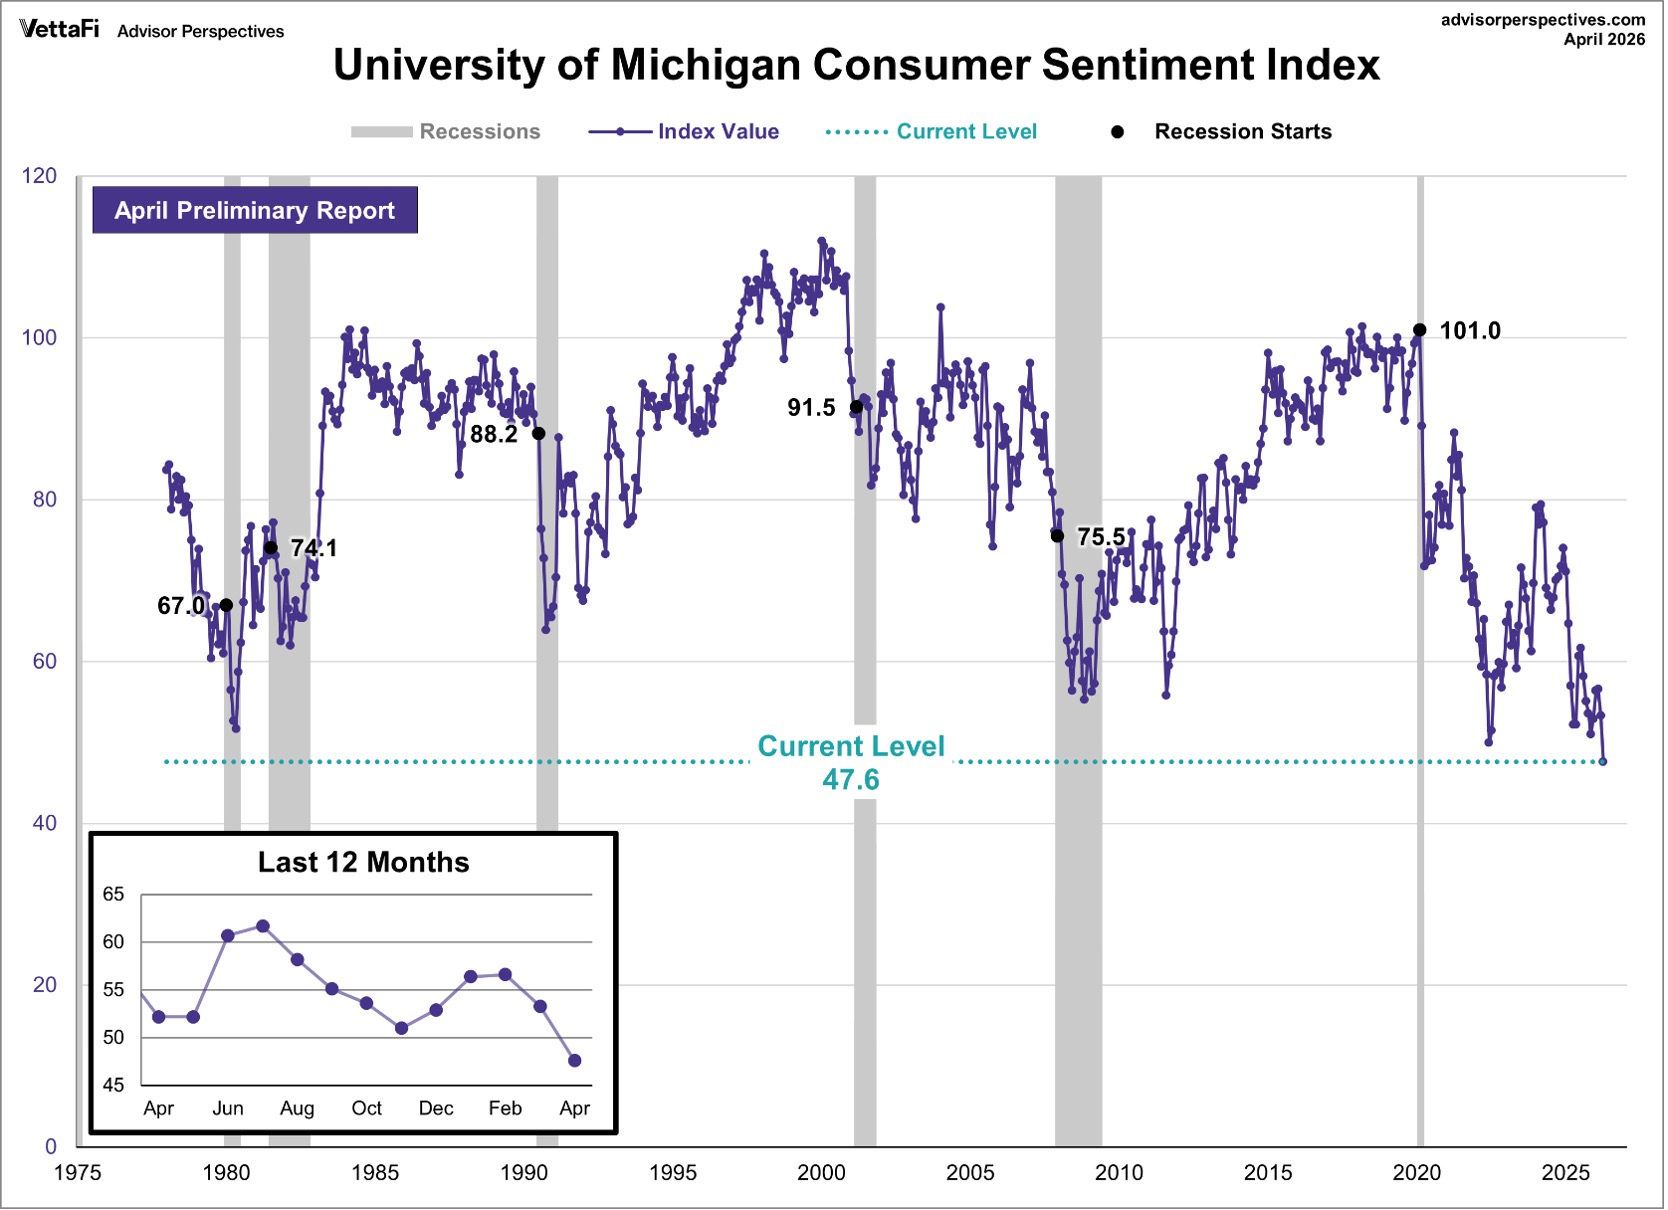 Caption: To put today’s report in historical context, consumer sentiment is currently 43.3% below its average reading of 83.9 (arithmetic mean) and 42.4% below its geometric mean of 82.7, based on data dating back to 1978.
Key Takeaways, Courtesy of Survey of Consumers:
- Year-ahead inflation expectations surged from 3.8% in March to 4.8% this month, the largest one-month increase since April 2025. The current reading exceeds 2024 data and remains well above the 2.3%-3% range seen in the two years pre-pandemic.
- Long-run inflation expectations ticked up from 3.2% last month to 3.4% this month, the highest reading since November 2025. In 2024, values ranged between 2.8% and 3.2%, while in 2019 and 2020, they were consistently below 2.8%.
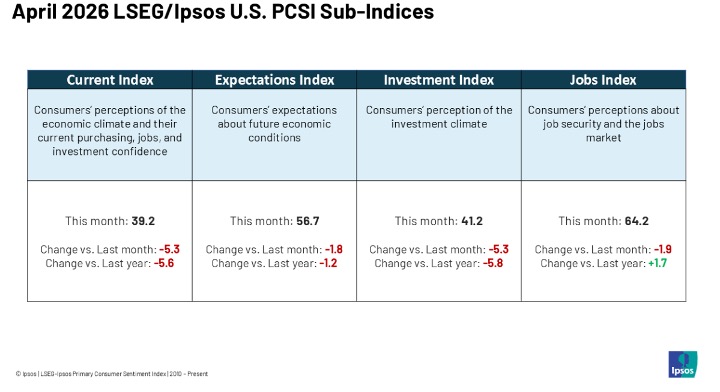 Caption: The LSEG/Ipsos Primary Consumer Sentiment Index for April 2026 is at 50.0. Fielded from March 20-25, 2026, the Index is down 3.4 points from last month.
Confidence
Editor’s note: The data for the Confidence section and the Key Takeaways below have not yet been released for the month of April. The information below is from the March KPI report. We will update this section as soon as the data is available.
The Conference Board Consumer Confidence Index® increased from 91.0 in February to 91.8 in March. The Present Situation Index—based on consumers’ assessment of current business and labor market conditions—increased by 4.6 points to 123.3. Meanwhile, the Expectations Index—based on consumers’ short-term outlook for income, business and labor market conditions—declined by 1.7 points to 70.9.
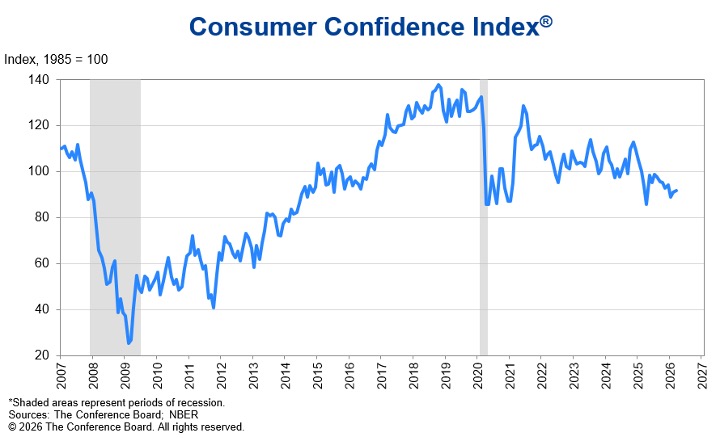
“Consumer confidence ticked up again in March, as a modest improvement in consumers’ views of current conditions outweighed a slight downshift in expectations for the future,” says Dana M. Peterson, chief economist at The Conference Board.
While three of five components “firmed” in March and overall confidence improved modestly for a second month, she says the Index has been on a general downward trend since 2021.
On a six-month moving average basis, confidence continued to moderate for consumers under age 35 and 55-plus. However, it remained virtually unchanged for those aged 35 to 54, following a multi-month decline. Respondents under 35 were the most optimistic and those 55 and over the least. By income, confidence on a six-month moving average basis continued to dip in six of eight groups. Only consumers earning $25,000-34,999 and $125,000-plus were somewhat more optimistic. Consumer confidence by political affiliation was relatively unchanged. Republicans remained the most optimistic, while confidence was substantially lower among Independents and Democrats.
“Unsurprisingly given the Iran war oil shock, consumers’ average and median 12-month inflation expectations surged in March to levels last seen in August 2025, when U.S. consumers awaited more tariff announcements from the U.S. federal government. Consequently, the percentage of consumers stating that interest rates over the next 12 months will be higher on net skyrocketed from 34.9% to 42.4%. Expectations for higher stock prices a year from now plunged,” Peterson says.
Key Takeaways, Courtesy of The Conference Board:
- Consumers’ views of their Family’s Current Financial Situation improved slightly after a February retreat. Expectations for their Family’s Future Financial Situation continued to be less optimistic.
- The share of consumers who said a U.S. recession over the next 12 months is “very likely” rose, while those saying “somewhat likely” or “not likely” fell. The cohort believing the U.S. is already in a recession was virtually unchanged.
- Consumers’ plans to buy big-ticket items over the next six months shifted from “yes” and “maybe” in February to “no” in March. Nonetheless, the proportion saying “yes” remained well above the other responses. Used cars, furniture, TVs and smartphones remained the most popular items within respective categories for future purchases. Among all expensive items, furniture persists as the top expected purchase.
- Buying plans for autos continued rising on a six-month moving average basis in March, with used cars remaining the clear preference over new cars. Homebuying expectations were somewhat lower on a six-month rolling basis for both existing and new units, with consumers continuing to prefer existing homes to newly built ones. Purchase plans for all types of home furnishings, white goods and electronics on a six-month moving average basis improved in March.
- Consumers planning more spending on services over the next six months also shifted from “yes” and “maybe” to “no.” Consumer spending trends in 2026 remain focused on “cheap thrills” and necessary services – and away from expensive and highly discretionary activities.
“Consumers’ write-in responses on factors affecting the economy continued to skew towards pessimism. Comments about prices and the cost of goods suggest that the cost of living remained at the top of consumers’ minds. As the war in Iran overlapped significantly with the survey sample period, comments about oil/gas and war/conflict spiked, while specific mentions of trade and tariffs decreased notably,” Peterson says.
Consumer Income & Spending
Personal income decreased $18.2 billion (0.1% at a monthly rate) in February, according to the U.S. Bureau of Economic Analysis (BEA). Disposable personal income (DPI)—personal income less personal current taxes—decreased $18.3 billion (0.1%), while personal consumption expenditures (PCE) increased $103.2 billion (0.5%).
Personal outlays—the sum of PCE, personal interest payments and personal current transfer payments—increased $106.5 billion in February. In February, personal saving was $931.5 billion and the personal saving rate—personal saving as a percentage of DPI—registered 4%.
The decrease in current-dollar personal income primarily reflected decreases in personal dividend income and personal current transfer receipts. The $103.2 billion increase in current-dollar PCE reflected increases of $58.7 billion in spending on goods and $44.5 billion in spending on services.
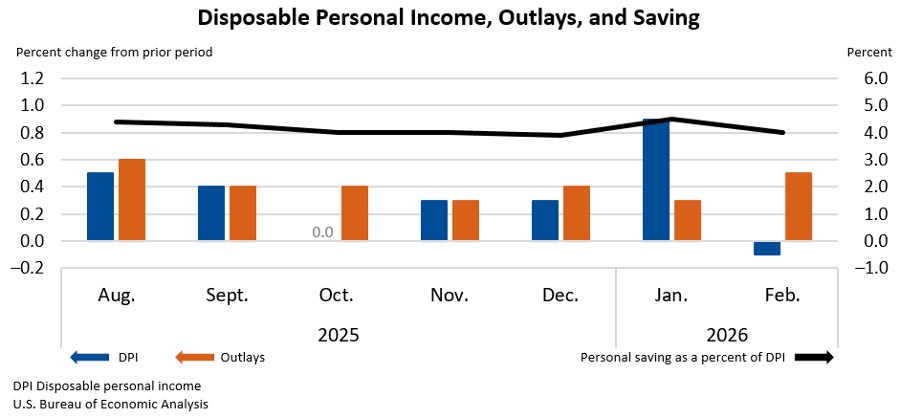
Key Takeaways, Courtesy of the U.S. Bureau of Economic Analysis:
- In February, real PCE increased $17.3 billion (0.1% at a monthly rate).
- The PCE price index increased 0.4% month-over-month. Excluding food and energy, the PCE price index also increased 0.4%.
- The PCE price index increased 2.8% year-over-year. Excluding food and energy, the PCE price index increased 3% from one year ago.