
KPI – February 2024: Recent Vehicle Recalls
KPI – February 2024: The Brief
KPI – February 2024: State of Business – Automotive Industry
KPI – February 2024: State of the Manufacturing
KPI – February 2024: Consumer Trends
In January, the Consumer Price Index for All Urban Consumers (CPI-U) increased 0.3% on a seasonally adjusted basis after rising 0.2% in December, according to the U.S. Bureau of Labor Statistics. Over the last 12 months, the all-items index increased 3.1% before seasonal adjustment.
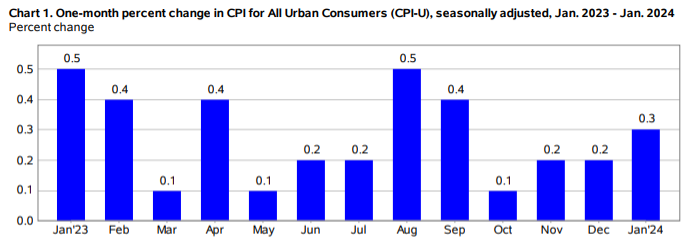
Important Takeaways, Courtesy of the U.S. Bureau of Labor Statistics:
- The index for shelter continued to rise in January, increasing 0.6% and contributing over two-thirds of the monthly all-items increase.
- The food index increased 0.4%, as the food at home index increased 0.4% and the food away from home index rose 0.5% month-over-month.
- In contrast, the energy index fell 0.9% due in large part to the decline in the gasoline index.
- Indexes on the incline include shelter, motor vehicle insurance and medical care.
- The index for used cars and trucks and the index for apparel were among those to decrease month-over-month.
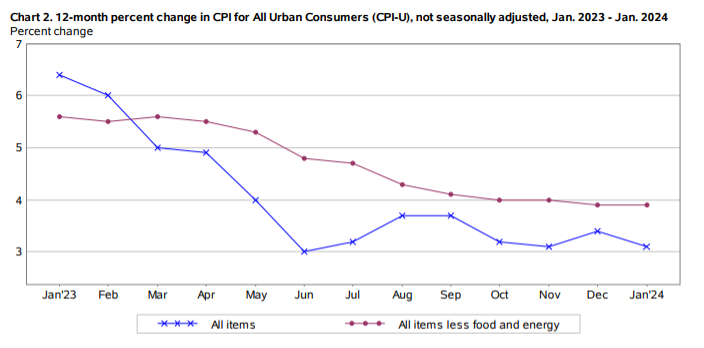
- The all-items index rose 3.1% year-over-year in January, smaller than the 3.4% increase last month. The all items less food and energy index rose 3.9% year-over-year, flat compared to last month.
- The energy index decreased 4.6% year-over-year, while the food index increased 2.6%.
EMPLOYMENT
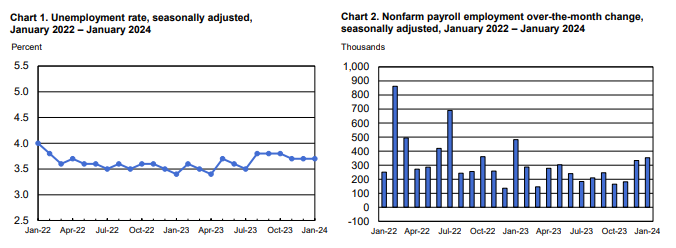
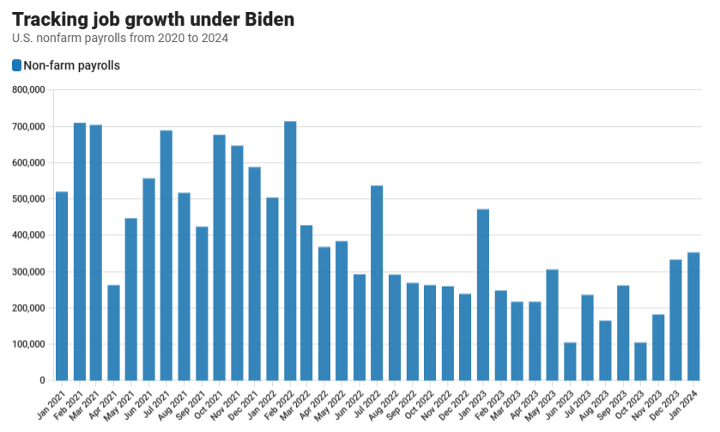
U.S. job growth surged unexpectedly in January, highlighting a resilient labor market even in the face of high interest rates and persistent inflation. Total non-farm payroll employment increased by 353,000 – surpassing the Dow Jones estimate of 185,000.
In January, the unemployment rate and number of unemployed persons were relatively unchanged at 3.7% and 6.1 million. The labor force participation rate and the long-term unemployed (those jobless for 27 weeks or more) hovered at 62.5% and 20.8%, respectively, according to the U.S. Bureau of Labor Statistics.
Wage growth posted strong numbers as well, as average hourly earnings increased 0.6% – double the monthly estimate. On a year-over-year basis, wages grew 4.5% (above the 4.1% forecast). Moreover, the wage gains rose alongside a decline in average hours worked – down to 34.1, or 0.2 hour lower for the month.
Economists point out that the labor market has remained “historically tight” over the past year, defying widespread expectations of a slowdown.
“Make no mistake, this was a blowout jobs report and will vindicate the recent posturing by the Fed, which effectively ruled out an interest rate cut in March,” says George Mateyo, chief investment officer at Key Private Bank. “Moreover, strong job gains combined with faster than expected wage gains may suggest an additional delay in rate cuts for 2024 and should cause some market participants to recalibrate their thinking.”
While employment data shows the economy lost 1.5 million full-time workers since June of last year – a figure that has been insulated by 796,000 part-time employees – economists agree this is a jobs report that should be celebrated.
Source: U.S. Bureau of Labor Statistics data
BY DEMOGRAPHIC
Unemployment rates among the major worker groups: adult women – 3.2%, adult men 3.6%, teenagers – 10.6%, Asians 2.9%, Whites – 3.4%, Hispanics 5% and Blacks – 5.3%.
Last month, unemployment rates among the major worker groups: adult women – 3.3%, adult men – 3.5%, teenagers – 11.9%, Asians – 3.1%, Whites – 3.5%, Hispanics – 5.0% and Blacks – 5.2%.
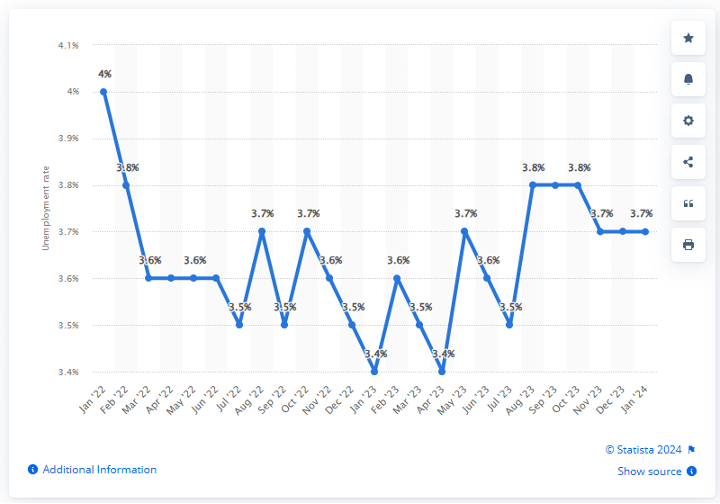
Caption: The seasonally adjusted national unemployment rate is measured monthly in the U.S. In January 2024, the national unemployment rate was at 3.7%. Seasonal adjustment is a statistical method of removing the seasonal component of a time series that is used when analyzing non-seasonal trends.
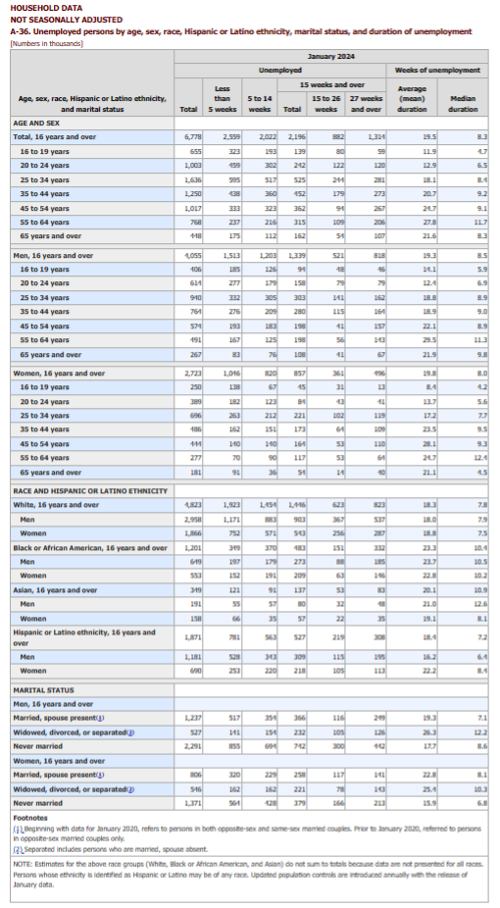
Image Source: A-36. Unemployed persons by age, sex, race, Hispanic or Latino ethnicity, marital status, and duration of unemployment (bls.gov).
BY INDUSTRY
In January, the largest job gains occurred in professional and business services, healthcare, retail trade and social assistance. Government employment continued to trend up as well, at a surplus of 36,000 jobs – below its 57,000 average monthly gain but still elevated.
“The Employment Trends Index (ETI) increased for a second consecutive month, suggesting employment growth will continue in the coming months,” says Selcuk Eren, senior economist at The Conference Board. “Payroll gains were economy-wide in January 2024, after being predominantly driven by three industries (healthcare and social assistance, leisure and hospitality, plus government) in the second half of 2023.”
Temporary help services – an early indicator for hiring in other industries and a component of the ETI – added jobs in January, breaking the downward trend observed since April 2022. Furthermore, Eren notes the percentage of consumers saying jobs were “hard to get” in The Conference Board Consumer Confidence Survey – another ETI component – is back to single digits for the first time since March 2022.
“With job openings remaining elevated compared to pre-pandemic levels and layoffs at an historic low, the prospects of a soft landing continue to rise,” Eren says.
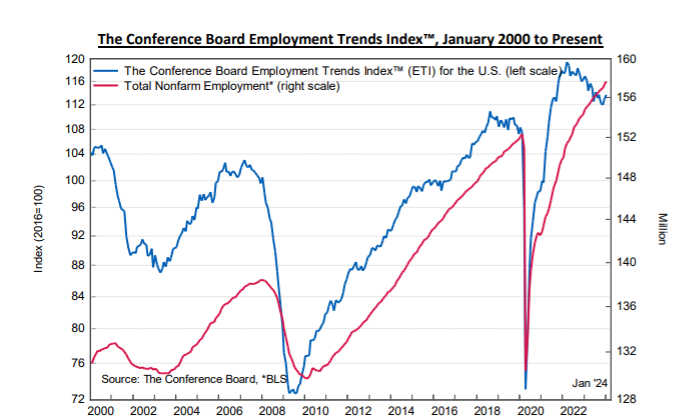
Caption: The Conference Board Employment Trends Index (ETI) increased in January to 113.71, up from a downwardly revised 112.91 in December. The Employment Trends Index is a leading composite index for employment. When the Index increases, employment is likely to grow as well, and vice versa. Turning points in the Index indicate that a change in the trend of job gains or losses is about to occur in the coming months.
Important Takeaways, Courtesy of the U.S. Bureau of Labor Statistics:
- Professional and business services added 74,000 jobs in January, considerably higher than the average monthly increase of 14,000 jobs in 2023. Professional, scientific and technical services added 42,000 jobs. Employment in temporary help services changed little month-over-month (plus-4,000) but is down by 408,000 since reaching a peak in March 2022.
- Employment in healthcare rose by 70,000, with gains in ambulatory health care services (plus-33,000), hospitals (plus-20,000), as well as nursing and residential care facilities (plus-17,000). Job growth in healthcare averaged 58,000 per month in 2023.
- Retail trade employment increased by 45,000 but has shown little net growth since early 2023. General merchandise retailers added 24,000 jobs, while electronics and appliance retailers lost 3,000 jobs.
- Employment in social assistance rose by 30,000, reflecting continued growth in individual and family services (plus-22,000). Social assistance grew by an average of 23,000 per month in 2023.
- Employment in manufacturing edged up (plus-23,000), with job gains in chemical manufacturing (plus-7,000) and printing and related support activities (plus-5,000). Manufacturing experienced little net job growth in 2023.
- Government employment continued to trend up (plus-36,000), though below the average monthly gain of 57,000 in 2023. A job gain occurred in federal government (plus-11,000), plus continued to climb in local government, excluding education (plus-19,000).
- Employment in information increased (plus-15,000), including in motion picture and sound recording industries (plus-12,000), while employment in telecommunications decreased (minus-3,000). Overall, employment in the information industry is down by 76,000 since a recent peak in November 2022.
- Employment in the mining, quarrying and oil and gas extraction industry declined by 5,000 in January, following little net change in 2023. Over the month, a job loss in support activities for mining (minus-7,000) was partially offset by a job gain in oil and gas extraction plus-2,000).
Click here to review more employment details.


