
KPI – February 2024: The Brief
KPI – February 2024: State of Manufacturing
KPI – February 2024: State of Business – Automotive Industry
KPI – February 2024: State of the Economy
KPI – February 2024: Recent Vehicle Recalls
The Conference Board Consumer Confidence Index rose to 114.8 (1985=100) in January, up from a downwardly revised 108.0 in December. The Present Situation Index – based on consumers’ assessment of current business and labor market conditions – jumped to 161.3 (1985=100), an increase from 147.2 last month.
The Expectations Index – based on consumers’ short-term outlook for income, business and labor market conditions – improved slightly to 83.8 (1985=100).
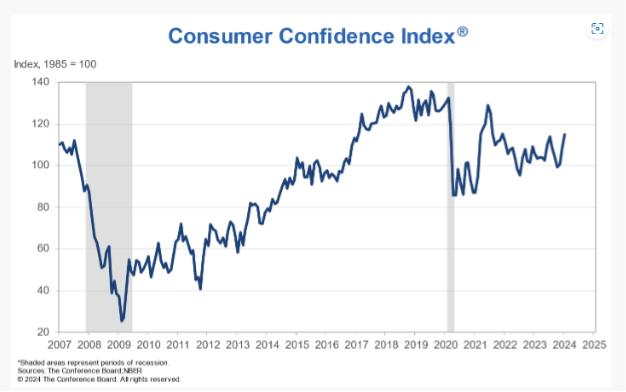
According to Dana Peterson, chief economist at The Conference Board, an increase in consumer confidence likely reflected the perception of slower inflation, anticipation of lower interest rates ahead and generally favorable employment conditions as companies continue to hoard labor.
Gains were recorded across all age groups, with data confirming the largest improvement among those ages 55 and older. Likewise, confidence improved for all incomes groups, except households earning $125,000-plus.
While certain data points showed promise, the perception versus reality of widespread improvement is more complex, from $34 trillion in national debt and a manufacturing sector in contraction to costly global conflict and a Consumer Price Index on the rise. In contrast to consumer confidence and sentiment data, a recent Axios Vibes survey showed many Americans actually feel “anxious and angry” at, for example, stubbornly high grocery prices.
“Though inflation has largely fallen from record highs in 2022, prices remain significantly higher than they were before 2020. Based on data from the Bureau of Labor Statistics, Americans must spend approximately $125.51 for groceries that would have cost $100 in December 2019,” according to the report.
In addition, buying plans dipped in January. On a month-to-month and six-month basis, consumers are pulling back on purchases of autos, homes and big-ticket appliances.
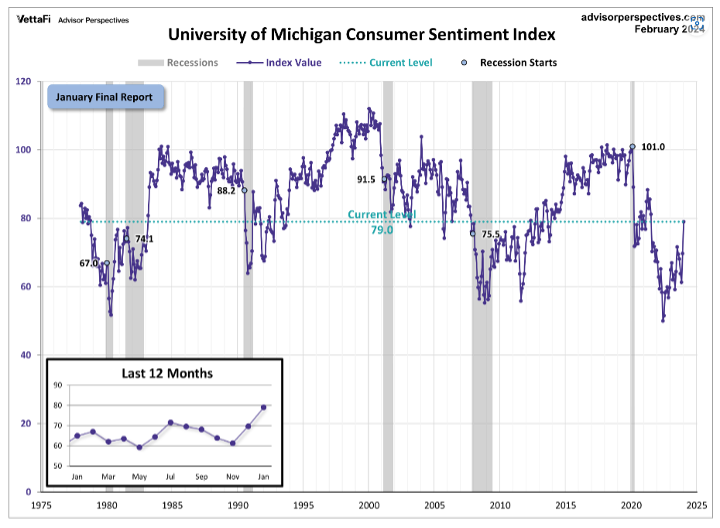
In addition, the University of Michigan Survey of Consumers – a survey consisting of approximately 50 core questions covering consumers’ assessments of their personal financial situation, buying attitudes and overall economic conditions – posted a score of 79.6 in the February preliminary results report.
Key Takeaways, Courtesy of Survey of Consumers:
- Five-year expectations for business conditions rose 5% to its highest reading since December 2020.
- Year-ahead inflation edged up from 2.9 in January to 3.0% in early February.
- For the second consecutive month, short-run inflation expectations fell within the 2.3-3.0% range seen in the two years prior to the pandemic.
- Long-run inflation expectations, however, remained at 2.9% for the third straight month – staying within the narrow 2.9-3.1% range for 28 of the last 31 months.
CONSUMER INCOME & SPENDING
According to the U.S. Bureau of Economic Analysis (BEA), in December 2023 personal income increased $60.0 billion (0.3% at a monthly rate), while disposable personal income – personal income less personal current taxes – increased $51.8 billion (0.3%).
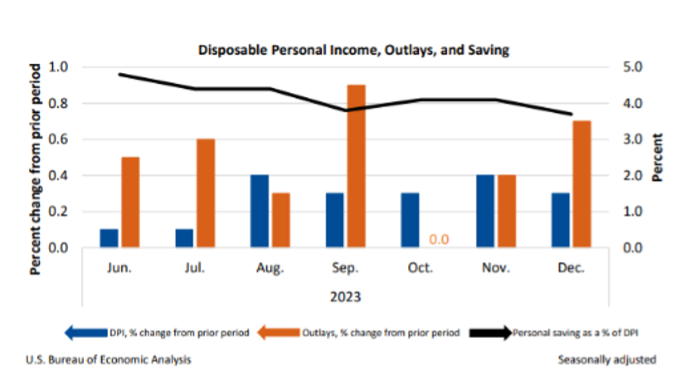
In addition, personal outlays – the sum of personal consumption expenditures, personal interest payments and personal current transfer payments – increased $134.7 billion (0.7%) and consumer spending increased $133.9 billion (0.7%). Personal saving was $766.7 billion and the personal saving rate – personal saving as a percentage of disposable personal income – was 3.7%.
Important Takeaways, Courtesy of BEA:
- In December, the $133.9 billion increase in consumer spending reflected increases in purchases for both services and goods. Within services, the largest contributors to the increase were financial services and insurance (led by financial service charges, fees and commissions); healthcare (both hospitals and outpatient services); and recreation services (led by gambling). Within goods, the largest contributors to the increase were motor vehicles and parts (led by new light trucks); other non-durable goods (led by prescription drugs); and gasoline and other energy goods (led by gasoline).
- The PCE price index for December increased 2.6%. Prices for services and goods increased 3.9% and less than 0.1%, respectively. Food prices increased 1.5%, while energy prices decreased 2.2%. Excluding food and energy, the PCE price index increased 2.9% year-over-year.


