KPI – February 2024: State of Business – Automotive Industry
Sponsored by: HOLLEY
KPI – February 2024: Recent Vehicle Recalls
KPI – February 2024: The Brief
KPI – February 2024: State of Manufacturing
KPI – February 2024: State of the Economy
KPI – February 2024: Consumer Trends
GLOBAL LIGHT VEHICLE SALES
In December, the Global Light Vehicle (LV) selling rate was 94 million units per year. The light vehicle market finished on a strong note, increasing 13% year-over-year. Robust domestic and export volume in China – up 24% year-over-year – led the way, with North America closing 2023 at 15% growth (primarily due to year-end discounting). Europe as a whole continued to struggle (plus-4%), with Western Europe contracting 4%.
According to GlobalData, January 2024 “is not expected to show any material drop-off in sales momentum,” which is typical at the start of a year. The selling rate is projected to be 92 million units, a 30% increase in volume year-over-year.
The company credits China for most of the estimated gain, as last January was particularly weak due to a COVID-19 outbreak and the expiration of certain tax incentives. Most other major markets are expected to increase by single digits.
“The forecast for global light-vehicle sales in 2024 is 92.4 million units per year, a nominal increase of 2% from 2023, though most of the attention may be below the topline,” says Jeff Schuster, group head and executive vice president of automotive at GlobalData. “Regulatory pressure remains on the industry for the transition to EVs and we expect continued expansion of the EV market in 2024. BEVs are forecasted to increase to 15% of global light-vehicle sales and EVs to nearly 35% of sales, but the transition is slower than needed in some markets to meet the various regulations.”
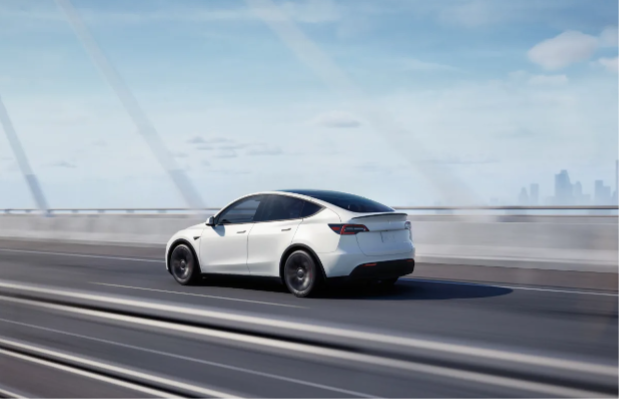
Caption: Tesla continues to dominate the U.S. EV market. The electric car company secured the top two spots in 2023, with Model Y sales hitting 394,497 units and Model 3 sales at 220,910, according to Kelley Blue Book. GM’s Chevrolet Bolt was a distant third, selling 60,045 EV and EUV units.
U.S. NEW VEHICLE SALES
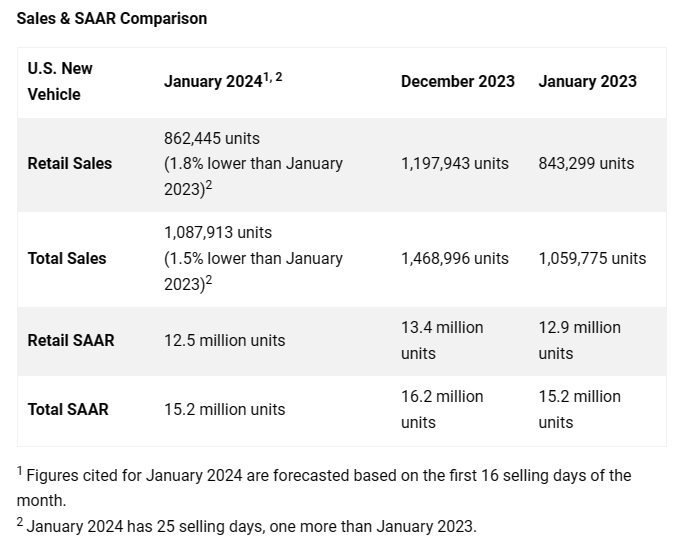
Total new vehicle sales for January 2024, including retail and non-retail transactions, are projected to reach 1,087,900 units – a 1.5% year-over-year increase, according to a joint forecast from J.D. Power and GlobalData.
“After December 2023 reached the strongest sales pace in several years, January’s pace has slowed to 15.2 million units,” says Thomas King, president of the data and analytics division at J.D. Power. “December’s SAAR of 16.2 million was inflated by elevated discounts from manufacturers, particularly as they aimed to clear out remaining inventory of 2023 model-year vehicles. In addition, changes in the eligibility of many electric vehicles to qualify for government rebates, which took effect Jan. 1, meant many EV purchases that would have occurred in January were made in December.”
Since January is the time of year when the fewest vehicles are sold, King says the aforementioned factors have a bigger effect on the SAAR than they would in higher-volume months.
“While the drop in the SAAR is notable, January sales results historically are not particularly indicative of future sales performance,” he says.
Important Takeaways, Courtesy of J.D. Power:
- Retail buyers are on pace to spend $37 billion on new vehicles in January 2024, down $0.7 billion year-over-year.
- Trucks/SUVs are estimated to account for 79% of new vehicle retail sales.
- The average new vehicle retail transaction price is expected to reach $45,106, down $1,636 year-over-year.
- Average incentive spending per unit is estimated to reach $2,346, up from $1,346 year-over-year.
- Average interest rates for new vehicle loans are predicted to increase to 7.1%, 34 basis points higher than a year ago.
- The total retailer profit per unit, which includes vehicles gross plus finance and insurance income, is on pace to hit $2,817 in January, down 28.5% year-over-year.
- Fleet sales are expected to total 225,468 units, flat year-over-year on a selling day adjusted basis. Fleet volume is expected to account for 20.7% of total light-vehicle sales, up 0.3 ppts from a year ago.
“In 2024, retail inventory is expected to keep rising and that increase in supply will lead to moderation in pricing. Additionally, anticipated interest rate cuts will also help affordability. This trend will drive an increase in sales, but at the expense of OEM and retailer per-unit profitability. This trade-off between increased volume and lower per-unit profit means that total profitability for OEMs and retailers will remain very strong relative to historical levels,” King says.
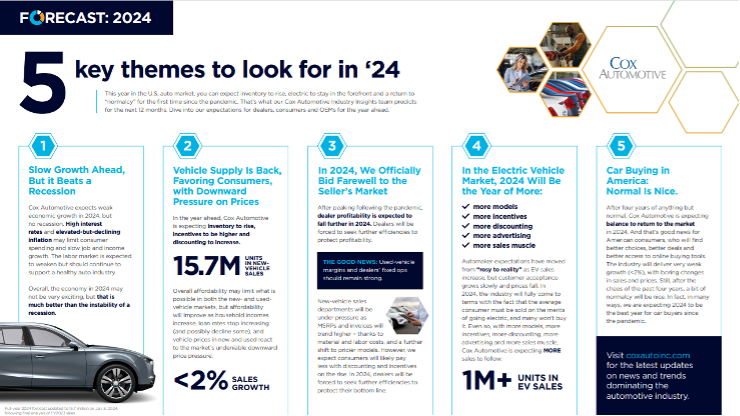
Review a comprehensive 2024 forecast, courtesy of Cox Automotive.
U.S. USED MARKET
Wholesale used vehicle prices (on a mix, mileage and seasonally adjusted basis) were unchanged in January 2024 compared to December 2023. The Manheim Used Vehicle Value Index (MUVVI) remained at 204.0 but is down 9.2% year-over-year. The index experienced the same 0.0% monthly change from December 2021 to January 2022.
“With the volatility we saw last year, it was a welcome sign for the industry to have a calmer month,” says Jeremy Robb, senior director of economic and industry insights for Cox Automotive. “We observed some price declines in the market in the first couple of weeks of January before the winter storm slowed activity in the wholesale markets during the King holiday week. As activity picked up later in the month, we saw more buying activity, which led to flat values in January. The 0.0% month-over-month change showed stronger values than the 0.2% decline we typically see in January.”
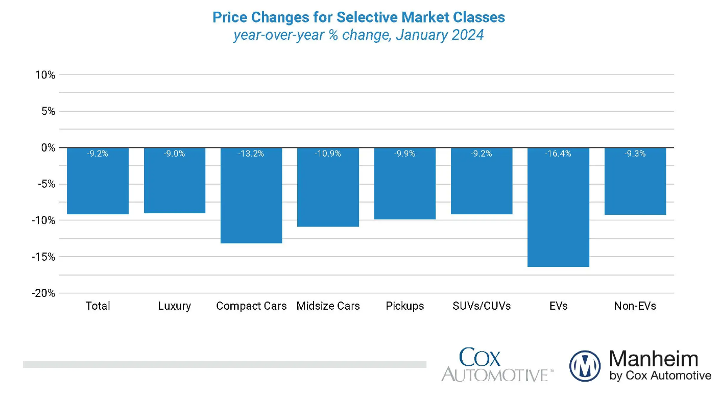
According to Manheim, major market segments posted seasonally adjusted prices that remained lower year-over-year in January, i.e., luxury decreased less than the industry at large, down 9%. Compact cars were down 13.2%, followed by mid-size cars, pickups and SUVs at -10.9%, minus-9.9% and flat to the industry’s 9.2% loss, respectively.
Compared to last month, luxury, SUVs and pickups were down 0.8%, 0.6% and 0.2%, respectively. Compact and mid-size cars were up nominally at 0.4% and 0.1%, respectively.
Overall, used vehicle prices are $28,100, reflecting a 2.4% or $694 decrease year-over-year. J.D. Power says the decline in used= vehicle values is translating to lower trade-in equity for consumers. The average trade-in equity is trending towards $8,345, down $1,048 from a year ago.
“As we move into tax refund season, we expect to see a bit more activity in the wholesale market, and we maintain that 2024 should show more normal market trends through the year,” adds Robb.


