
KPI – March 2024: Recent Vehicle Recalls
KPI – March 2024: State of Business — Automotive Industry
KPI – March 2024: State of the Manufacturing
KPI – March 2024: Consumer Trends
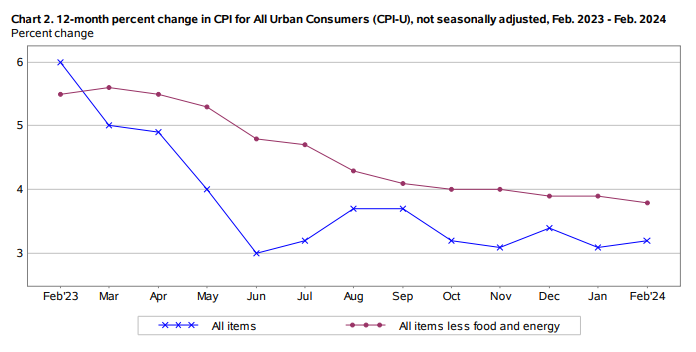
In February, the Consumer Price Index for All Urban Consumers (CPI-U) increased 0.4% on a seasonally adjusted basis, following a 0.3% rise in January, notes the U.S. Bureau of Labor Statistics. Over the last 12 months, the all-items index increased 3.2% before seasonal adjustment.
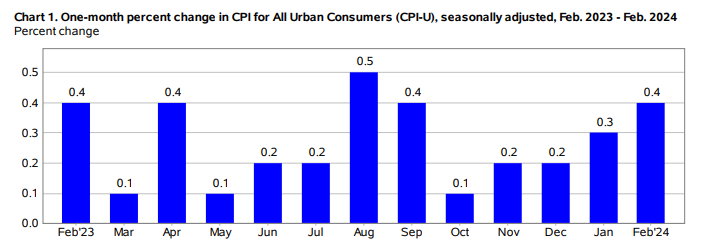
Important Takeaways, Courtesy of the U.S. Bureau of Labor Statistics:
- The indexes for shelter and gasoline swelled in February. Combined, these two indexes contributed to over 60% of the monthly increase in the index for all-items. The energy index grew 2.3% month-over-month, while the food and food-at-home indexes were unchanged. The food-away-from-home index increased 0.1%.
- Indexes on the incline include shelter, airline fares, motor vehicle insurance, apparel and recreation.
- The indexes for personal care and household furnishings and operations were among those to decrease month-over-month.
- The all-items index rose 3.2% year-over-year, surpassing the 3.1% increase last month. The all-items less food and energy index rose 3.8% over the last 12 months. The energy index decreased 1.9%, while the food index increased 2.2% over the last year.
EMPLOYMENT
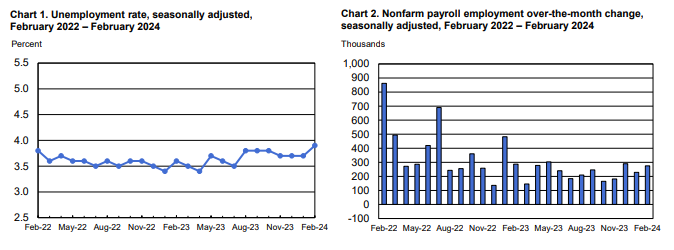
Total nonfarm payroll employment increased by 275,000 in February – surpassing the Dow Jones’ estimate of 198,000. The unemployment rate and number of unemployed persons rose to 3.9% and 6.5 million. The labor force participation rate and the long-term unemployed (those jobless for 27 weeks or more) hovered at 62.5% and 18.7%, respectively, according to the U.S. Bureau of Labor Statistics.
Job creation leaned toward part-time positions. Data shows full-time jobs decreased by 187,000, while part-time employment increased by 51,000. CNBC contributor Jeff Cox points to an “alternative jobless measure,” sometimes referred to as the real unemployment rate. It includes discouraged workers and those holding part-time jobs for economic reasons – a number which rose slightly month-over-month to 7.3%.
Moreover, average hourly earnings – a key inflation indicator – fell short on projections. Wages rose 0.1% on the month (one-tenth of a percentage point below the estimate) and were up 4.3% year-over-year, down from the 4.5% gain in January and slightly below the 4.4% estimate. The number of hours worked inched up, with the average work week recorded at 34.3 hours – a relatively unchanged 0.1 percentage point increase.
“It’s got literally a data point for every view on the spectrum,” says Liz Ann Sonders, chief investment strategist at Charles Schwab. “Those range from the economy is plunging into a recession to Goldilocks, everything is fine, nothing to see here. It’s certainly mixed.”
One trend is severe month-over-month downwardly revisions in employment data. Last month, the Biden Administration and economists touted a “blockbuster” jobs report – only to drastically reduce the gains from 353,000 to 229,000. A sharp – and underreported – revision of 124,000 job gains masks the true health of the labor market and economy at large.
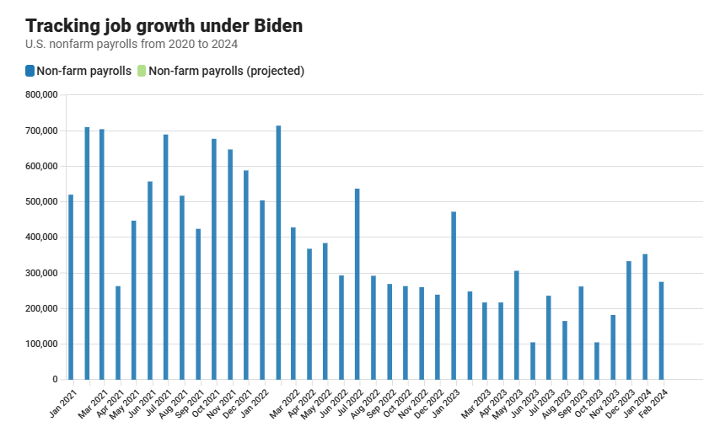
Source: U.S. Bureau of Labor Statistics data
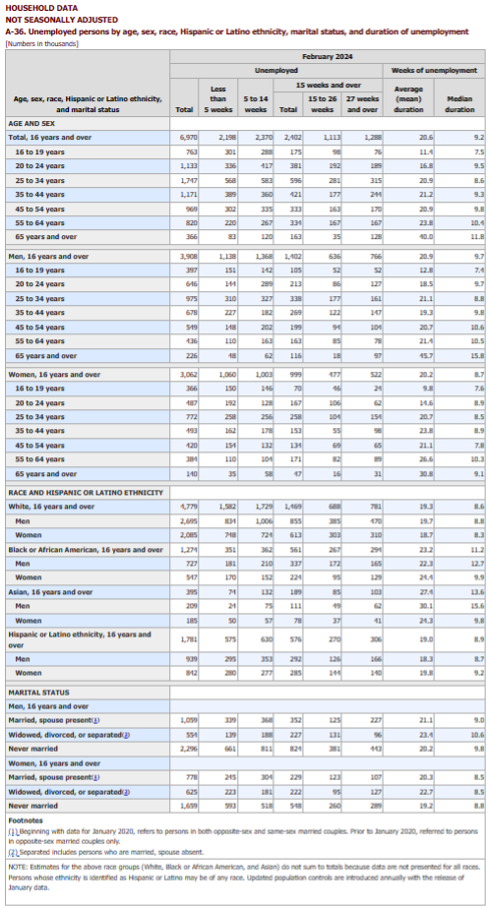
BY DEMOGRAPHIC
This month, unemployment rates among the major worker groups were: adult women – 3.5%, adult men – 3.5%, teenagers – 12.5%, Asians – 3.4%, Whites – 3.4%, Hispanics – 5% and Blacks – 5.6%.
Last month, unemployment rates among the major worker groups were: adult women – 3.2%, adult men 3.6%, teenagers – 10.6%, Asians 2.9%, Whites – 3.4%, Hispanics 5% and Blacks – 5.3%.
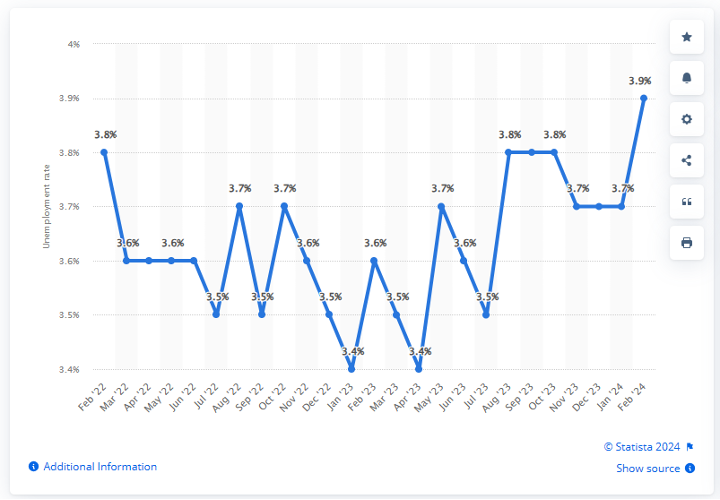
Caption: The seasonally adjusted national unemployment rate is measured monthly in the U.S. In February 2024, the national unemployment rate was at 3.8%. Seasonal adjustment is a statistical method of removing the seasonal component of a time series that is used when analyzing non-seasonal trends.
BY INDUSTRY
In February, the largest job gains occurred in healthcare, government, food services and drinking places, as well as social assistance. These four sectors accounted for 185,000 of the reported 275,000 job gains.
“The ETI decreased in February after two consecutive months of modest increases,” says Will Baltrus, associate economist at The Conference Board. “February’s payroll gains were again concentrated in healthcare and social assistance, leisure and hospitality, (as well as) government – accounting for 73% of jobs added. Apart from these sectors, job growth broadened for the third straight month, with modest growth in construction, retail trade and transportation and warehousing. However, other labor market gauges were weaker in the month.”
He points to an elevated unemployment rate concentrated among younger workers, especially those aged 16-24. Temporary help services – an early indicator for hiring in other industries and a component of the ETI – lost jobs in February, continuing the declines observed since April 2022.
Furthermore, Baltrus notes the percentage of consumers saying jobs were “hard to get” in The Conference Board Consumer Confidence Survey – another ETI component – edged up again, following an upward revision in January 2024.
“Looking ahead, we continue to project slower real GDP growth in Q2 and Q3, which may dampen demand but not extensively, given ongoing labor supply issues linked to labor shortages in key sectors,” Baltrus says.
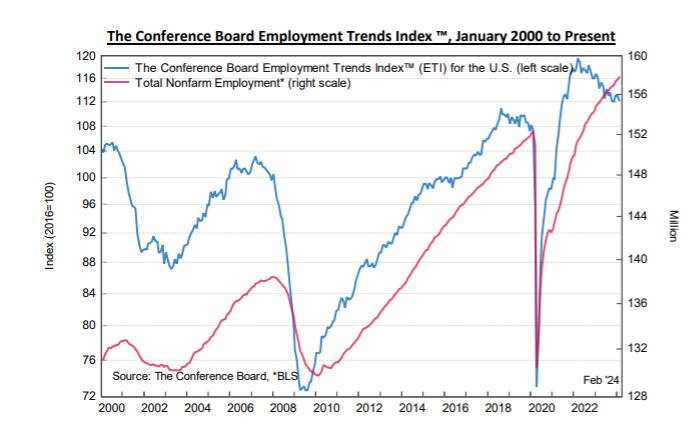
Caption: The Conference Board Employment Trends Index (ETI) decreased in February to 112.29, from a downwardly revised 113.18 in January. The Employment Trends Index is a leading composite index for employment. When the Index increases, employment is likely to grow as well, and vice versa. Turning points in the Index indicate that a change in the trend of job gains or losses is about to occur in the coming months.
Important Takeaways, Courtesy of the U.S. Bureau of Labor Statistics:
- Healthcare added 67,000 jobs in February, above the average monthly gain of 58,000 over the prior 12 months. Job growth continued in ambulatory healthcare services (+28,000), hospitals (+28,000) and nursing and residential care facilities (+11,000).
- Government employment increased by 52,000, approximately the same as the prior 12-month average gain (+53,000). Employment continued to trend up in local government, excluding education (+26,000) and federal government (+9,000).
- Employment in food services and drinking places increased by 42,000, after being relatively unchanged the prior three months.
- Social assistance added 24,000 jobs, approximately the same as the prior 12-month average gain of 23,000. Job growth continued in individual and family services (+19,000).
- Employment in transportation and warehousing rose by 20,000. Couriers and messengers added 17,000 jobs, following a loss of 70,000 jobs during the prior three months. Job growth also occurred in air transportation (+4,000), while warehousing and storage lost 7,000 jobs. Employment in the transportation and warehousing industry remains down by 144,000 since reaching a peak in July 2022.
- Employment continued to trend up in construction (+23,000), in line with the average monthly gain of 18,000 over the prior 12 months. Heavy and civil engineering construction added 13,000 jobs.
- Retail trade employment changed little in February (+19,000) and has shown little net change throughout the year. Over the month, job gains in general merchandise retailers (+17,000); health and personal care retailers (+6,000); and automotive parts, accessories and tire retailers (+5,000) were partially offset by job losses in building material/garden equipment and supplies dealers (-6,000), plus electronics and appliance retailers (-2,000).
- Employment was relatively unchanged in other major industries, including mining, quarrying and oil and gas extraction; manufacturing; wholesale trade; information; financial activities; professional and business services; and other services.
Click HERE to review more employment details.