KPI – March 2024: Recent Vehicle Recalls
KPI – March 2024: State of Manufacturing
KPI – March 2024: State of the Economy
KPI – March 2024: Consumer Trends
GLOBAL LIGHT VEHICLE SALES
The Global Light Vehicle (LV) selling rate increased to 85 million units per year in February, an improvement from January but still sub-par compared to the second half of last year, according to industry experts.
While more than 6 million units were sold last month, year-over-year results were down 2.8% – primarily due to a contraction in China.
Numerous vital markets posted moderate selling rate growth in February. China’s selling rate improved moderately month-over-month. In the U.S., prices continued to ease and incentives were on the rise, supporting market expansion. Europe produced mixed results, with the West achieving growth and the East facing ongoing challenges.
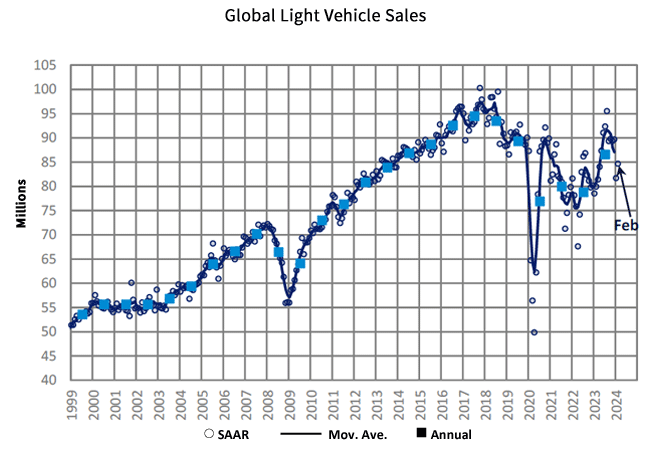
Caption: Market Lines is now excluding exports from the China sales total. The adjustment has been backdated to 2018.
“Global light vehicle sales in 2024 are projected to be 89.1 million units (adjusted for China exports), an increase of 3% from 2023. This maintains our view that growth will slow as natural demand – at current pricing – is now being met. Global inventory is expected to build slightly in 2024, as production returns to predictable levels and outpaces demand,” says Jeff Schuster, group head and executive vice president of automotive at GlobalData. “This year remains on target to return to a more normalized pattern of demand, but the market will not be without challenges from an economic slowdown and from external factors, like the Red Sea shipping attacks and the potential for military escalation in the Middle East.”
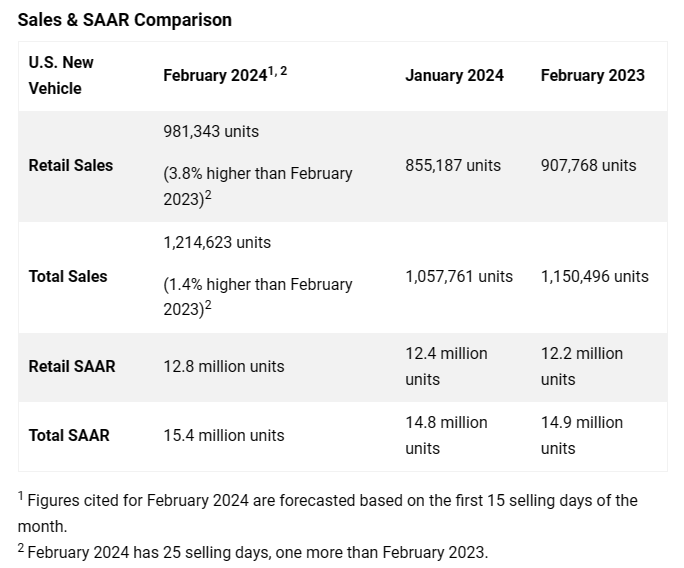
U.S. NEW VEHICLE SALES
Total new vehicle sales for February 2024, including retail and non-retail transactions, are projected to reach 1,214,600 units – a 1.4% year-over-year increase, according to a joint forecast from J.D. Power and GlobalData.
“This month, the new-vehicle market is poised for volume growth with total sales expected to rise a modest 1.4% and retail sales growing 3.8%, selling day adjusted. This volume growth is being driven by higher inventory levels, higher manufacturer incentives and lower retailer profit margins, all of which translate into declining average transaction prices,” says Thomas King, president of the data and analytics division at J.D. Power. “Despite the landscape shifting toward increased volume with diminished per-unit profits, retail customers will still spend more on new vehicles this month than in any other February on record.”
Important Takeaways, Courtesy of J.D. Power:
- Retail buyers are on pace to spend $40.8 billion on new vehicles – up $1.4 billion year-over-year.
- Trucks/SUVs are expected to account for 79% of new vehicle retail sales in February.
- The average new vehicle retail transaction price in February is predicted to reach $44,045 – down $1,919 year-over-year.
- Average incentive spending per unit is on pace to reach $2,565 – up from $1,464 last year.
- Average interest rates for new-vehicle loans are expected to increase to 6.9%, 17 basis points higher than a year ago.
- Total retailer profit per unit, which includes vehicles gross plus finance and insurance income, is expected to be $2,574, down 31.3% year-over-year.
- Fleet sales are on pace to total 233,279 units in February, down 7.7% year-over-year on a selling day adjusted basis. Fleet volume is expected to account for 19.2% of total light-vehicle sales, down 1.9 percentage points from a year ago.
Looking ahead, “it’s apparent that the industry is returning to traditional pre-pandemic dynamics after nearly three years of inventory constraints. Competition between OEMs and retailers to attract buyers to showrooms is rising, and the seasonality of both consumer demand and promotional activity is returning. This is good news for shoppers who have struggled to find their desired vehicle at an affordable price, but points to a more challenging profit environment for OEMs and retailers,” King says.
Review a comprehensive 2024 forecast, courtesy of Cox Automotive.
U.S. USED VEHICLE MARKET
Wholesale used vehicle prices (on a mix-, mileage- and seasonally adjusted basis) decreased 0.6% from February during the first 15 days of March. The mid-month Manheim Used Vehicle Value Index dropped to 202.6, which was down 14.9% year-over-year.
Data shows a seasonal adjustment drove the decline. Non-adjusted price change during the first half of March rose 2.8% compared to February, while the unadjusted price was down 11.6% year-over-year.
“Historically, used retail sales peak in March or April of a given year as tax refunds inject money into the economy,” says Jeremy Robb, senior director of Economic and Industry Insights at Cox Automotive. “As the average tax refund is up 6% so far in 2024, consumers were driven to the used retail market earlier in the year, leading to stronger used vehicle sales in February than we have seen the last couple of years.”
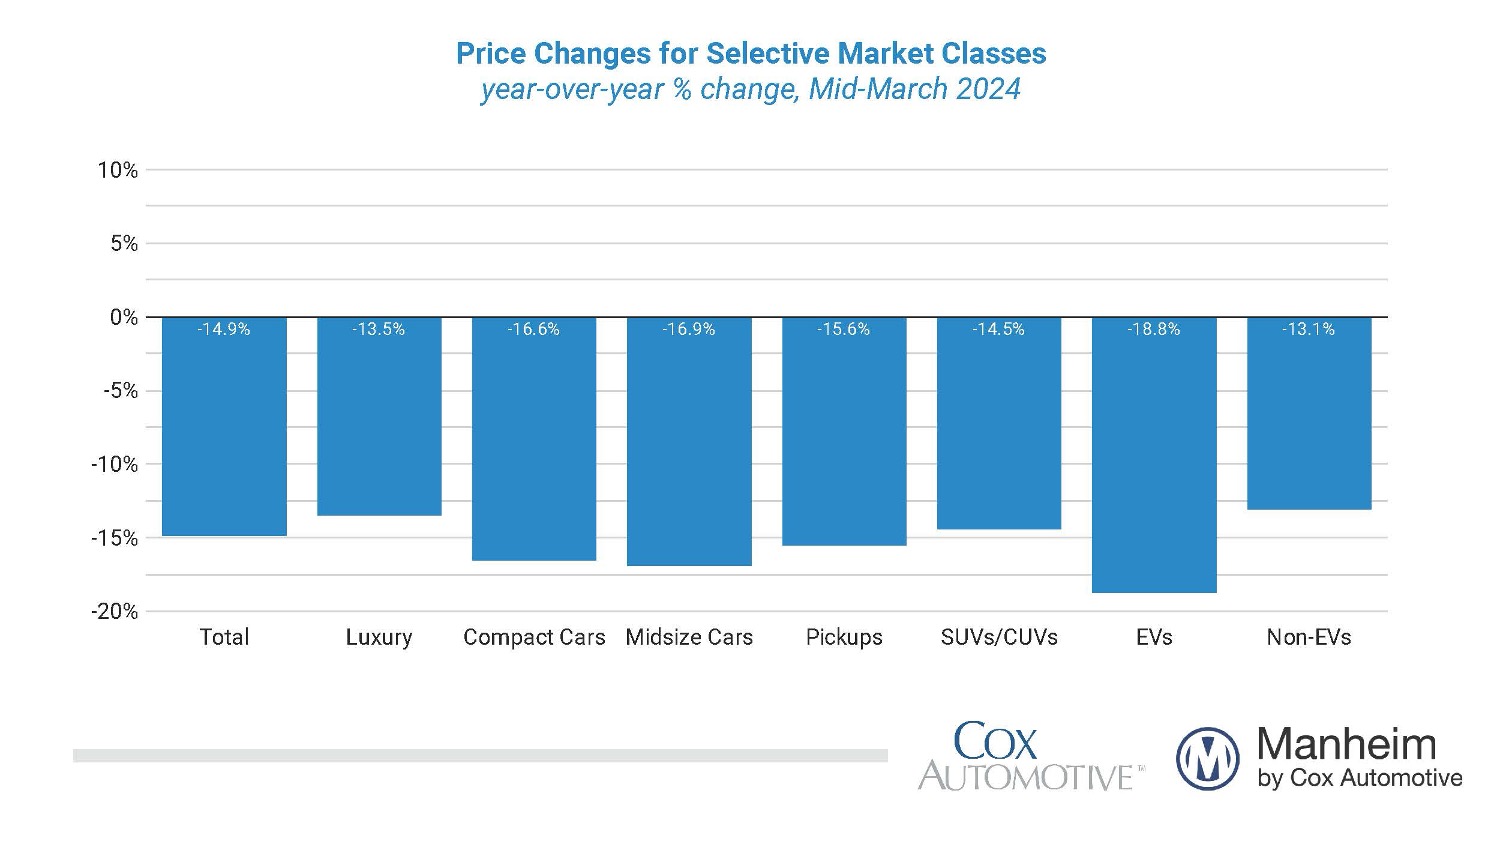
According to Manheim, all major market segments posted seasonally adjusted prices that remained lower year-over-year during the first half of March. The company says compared to the industry’s year-over-year decline of 14.9%, luxury was down 13.5% and SUVs declined 14.5%. Mid-size cars, compact cars and pickups performed worse than the industry overall, at minus-16.9%, minus-16.6% and minus-15.6%, respectively.
While the industry at large was down 0.6% versus prior month, compact cars were up 1.1%, SUVs were up 0.2% and luxury remained flat at 0.0%. Mid-size cars declined 0.2%, outperforming the index overall, while trucks dipped 0.8%. It was the only segment to fare worse than the industry average.
Electric vehicles (EVs) were down 18.8% year-over-year, while the non-EV segment declined by 13.1%. Month-over-month, non-EVs declined by 0.3% during the first half of March, while EVs were down 4.9%.
Overall, average used vehicle retail prices are $28,121 – reflecting a 2.4%, or $700, year-over-year decrease. The decline in used vehicle values is translating to lower trade-in equity for consumers, adds J.D. Power.
The average trade-in equity is trending toward $7,912, down $992 from a year ago.