
KPI – March 2024: State of Manufacturing
KPI – March 2024: State of Business – Automotive Industry
KPI – March 2024: State of the Economy
KPI – March 2024: Recent Vehicle Recalls
Below is a synopsis of consumer confidence, sentiment, demand and income/spending trends.
The Conference Board Consumer Confidence Index decreased to 106.7 (1985=100) in February, compared to a downwardly revised 110.9 in January. Furthermore, after three consecutive months of gains, data now suggests “there was not a material breakout to the upside in confidence at the start of 2024” as previously communicated.
The Present Situation Index – based on consumers’ assessment of current business and labor market conditions – scaled back to 147.2 (1985=100) in February from 154.9 in January. The Expectations Index – based on consumers’ short-term outlook for income, business and labor market conditions – dipped to 79.8 (1985=100), down from a revised 81.5 in January.
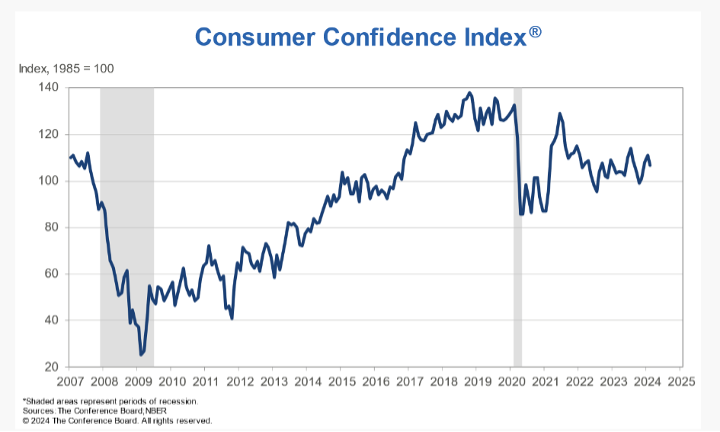
According to Dana Peterson, chief economist at The Conference Board, the decline in consumer confidence reflects persistent uncertainty about the U.S. economy. The drop in confidence proved broad-based, affecting all income levels except households earning less than $15,000 and those earning more than $125,000. Confidence deteriorated for consumers under the age of 35 and those 55 and over, whereas it improved slightly for those aged 35 to 54.
In addition, consumers’ assessments of their personal financial situation (a measure not included in calculating the Present Situation Index) weakened. While inflation remained top of mind, consumers expressed dismay at the labor market situation and U.S. political environment as well.
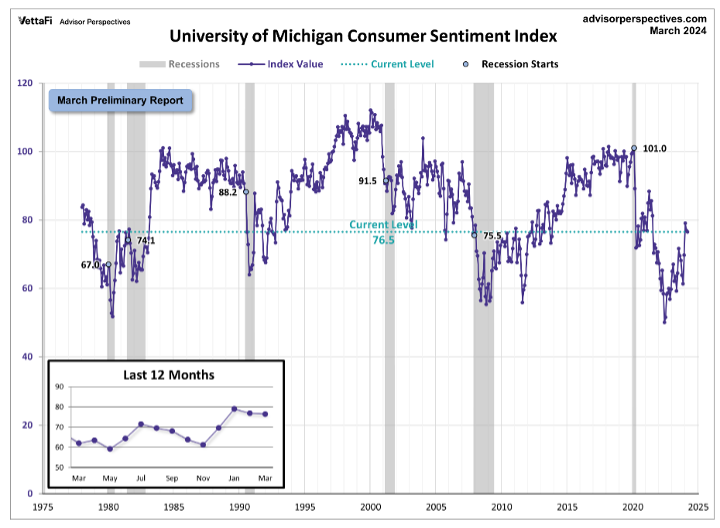
Similarly, the University of Michigan Survey of Consumers – a survey consisting of approximately 50 core questions covering consumers’ assessments of their personal financial situation, buying attitudes and overall economic conditions – posted uninspiring results, slipping from 76.9 in February to 76.5 in March.
According to Survey of Consumers, sentiment remained nearly 25% above November 2023 and is currently halfway between the historic low reached during the peak of inflation in June 2022 and pre-pandemic readings. Small improvements in personal finances were offset by modest declines in expectations for business conditions.
- Year-ahead inflation was unchanged month-over-month (at 3.0%).
- For the third consecutive month, short-run inflation expectations fell within the 2.3%-3.0% range.
- Long-run inflation expectations remained at 2.9% for the fourth straight month, staying within the narrow 2.9%-3.1% range for 29 of the last 32 months. Long-run inflation expectations are modestly elevated relative to the 2.2%-2.6% range seen in the two years pre-pandemic.
CONSUMER INCOME & SPENDING
According to the U.S. Bureau of Economic Analysis (BEA), in January 2024 personal income increased $233.7 billion (1% at a monthly rate), while disposable personal income – personal income less personal current taxes – increased $67.6 billion (0.3%).
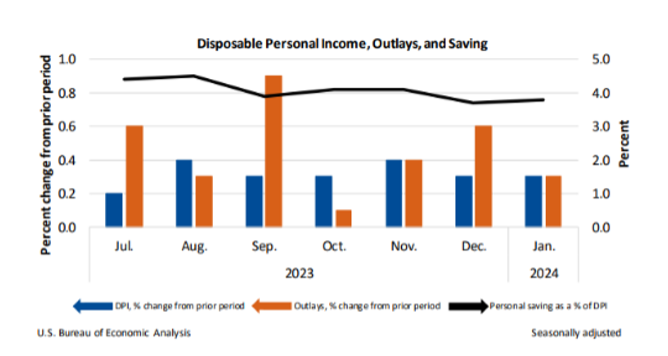
In addition, personal outlays – the sum of personal consumption expenditures, personal interest payments and personal current transfer payments – increased $54.3 billion (0.3%) and consumer spending increased $43.9 billion (0.2%). Personal saving was $779.3 billion and the personal saving rate – personal saving as a percentage of disposable personal income – was 3.8% in January.
Important Takeaways, Courtesy of BEA:
- In January, the $43.9 billion climb in consumer spending reflected an increase in spending for services, which was partly offset by a decrease in spending for goods. Within services, the largest contributors to the increase were housing and utilities; financial services and insurance (led by financial service charges, fees and commissions); as well as healthcare (led by hospitals). The largest contributors to the decrease in goods were motor vehicles and parts (led by new light trucks); gasoline and other energy goods (led by gasoline); and other nondurable goods (led by prescription drugs).
- Overall, the PCE price index for January increased 0.3%. Food prices inched up 0.5%, while energy prices declined 1.4%. Excluding food and energy, the PCE price index increased 0.4%. Moreover, the PCE price index jumped 2.4% year-over-year. Prices for services swelled 3.9%, while prices for goods decreased 0.5%. Food prices increased 1.4%, but energy prices decreased 4.9%. Excluding food and energy, the PCE price index increased 2.8% year-over-year.


