Work Truck Solutions: New Inventory Tightens as Used Truck Sales Climb in Q3
Quarterly commercial vehicle data shows shrinking dealer inventory, faster days to turn & rising used work truck & van sales…

Commercial vehicle authority Work Truck Solutions has released its Q3 2026 Commercial Vehicle Market Analysis. Q3 data reveals a commercial vehicle market operating at healthy operational levels, according to a company press release. Building on positive fleet replacement signals from Q2, new commercial vehicle sales movement per dealer expanded further even as on-lot availability tightened. Meanwhile, the pre-owned market continues to actively absorb fleet trade-ins, maintaining steady turnover while increasing in transaction volume.
New Work Truck & Van Inventory & Sales Trends
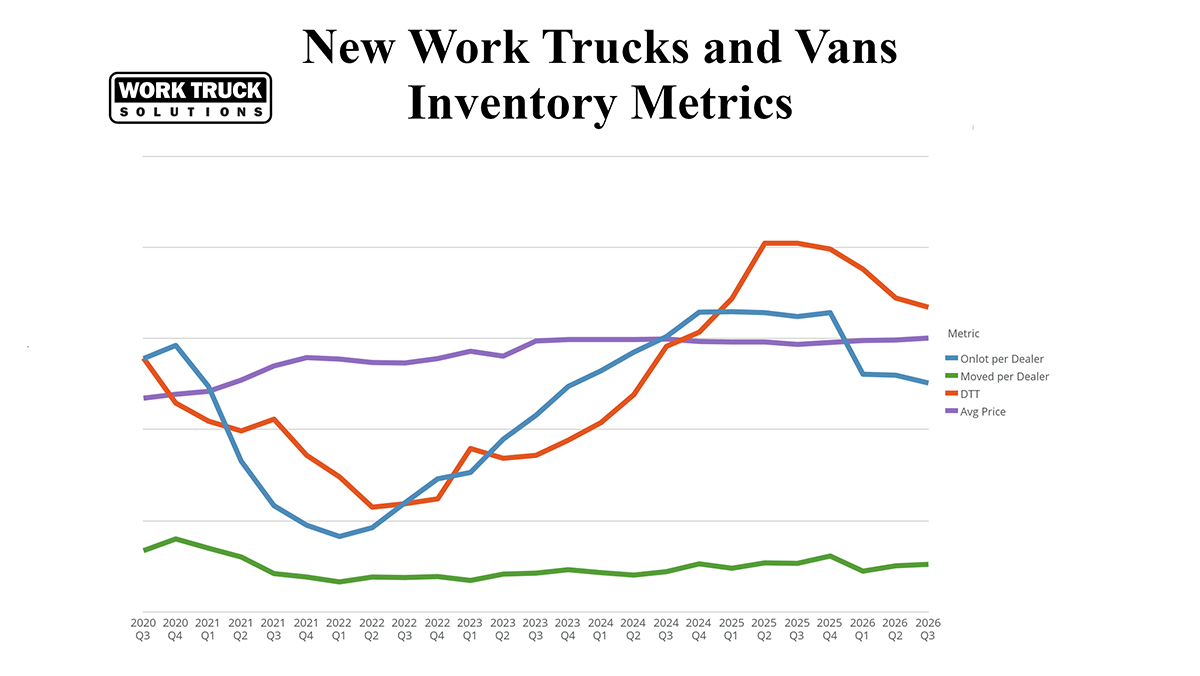
- The average final price for new work trucks increased a modest 0.8% quarter over quarter (QoQ) and 2.7% year over year (YoY).
- Following a brief Q2 plateau where inventory levels held flat, availability resumed its downward trend in Q3, with average on-lot inventory per dealer falling 3.1% QoQ to 126 units—a 22.2% contraction compared to Q3 2025.
- Sales (movement) per dealer rose 4.0% QoQ on the heels of Q2’s increase of 8.7%, but were down 3.7% YoY.
- Days to turn (DTT) continued to improve, falling to 167 days, reflecting a 2.9% QoQ decrease and a significant 17.3% decline YoY.
New vehicle availability continues a general downward trend, keeping dealer lots lean. Lean inventory, paired with demand, is accelerating inventory turnover, the release noted.
Used Commercial Vehicle Sales & Pricing Trends
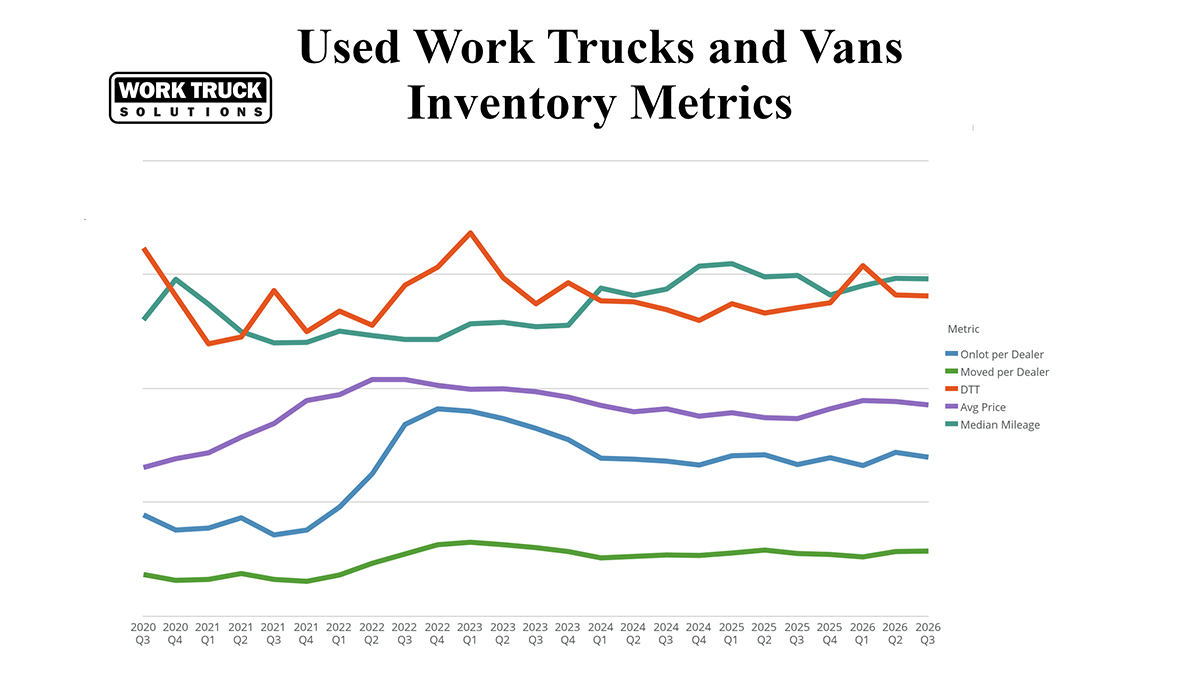
- The average final price for used commercial vehicles held nearly steady with only a marginal 0.7% QoQ decrease, while remaining 13.3% higher YoY.
- On-lot used inventory per dealer dipped slightly, down 3.4% QoQ, but up 3.7% YoY.
- Sales (movement) grew 9.1% QoQ and 9.1% YoY.
- DTT QoQ numbers remained steady at 56 days, but YoY DTT was up 3.7% compared to the Q3 2025 DTT metric of 54 days.
- The two-quarter upward trajectory of used vehicles’ median mileage nearly plateaued, revealing a minor drop of 0.2% QoQ and 1.1% YoY.
A plateau in median mileage shows that fleet managers are again cycling their fleet inventory more readily. Pre-owned work trucks and vans are turning over in under two months, demonstrating strong B2B buyer appetite for affordable operational assets, according to the report.
Electric & Hybrid Work Truck Pricing
The average final price for new battery electric (BEV), plug-in hybrid electric (PHEV) and hybrid electric (HEV) work trucks climbed 19.1% QoQ—sharply reversing last quarter’s 5.9% dip—and increased 14.2% YoY.
Regional Work Truck Market Shifts
This quarter also includes a new segment spotlight on regional data, where Central, Northeast, South and West activity revealed several noteworthy shifts in pricing, inventory and buyer behavior across IHS market regions. Readers can explore the full breakdown, including region-specific trends and insights, in Work Truck Solutions’ Q3 2026 Regional Market Analysis.
What Work Truck Dealers Should Watch
“Our Q3 2026 data shows a commercial vehicle market that is running lean in terms of inventory,” said Aaron Johnson, CEO of Work Truck Solutions. “New work truck inventory dipped, yet sales rose for the quarter and days to turn dropped. Commercial buyers are not waiting on the sidelines. As work truck availability remains tight, inventory sourcing tools like our Vehicle Acquisition Search Tool are helping dealers find the work trucks that businesses need, even when they don’t have that specific inventory on-lot.
“On the pre-owned side, we are seeing sustained momentum from fleet lifecycle rotations. Median mileage has essentially leveled off, and sales are up over 9% quarter over quarter, with vehicles continuing to turn quickly. Dealers using targeted digital merchandising to highlight the ongoing reliability and work-readiness of these pre-owned work trucks and vans are capitalizing.”
Work Truck Solutions points out that it’s important to note that these datasets include multiple subsets averaged within the segments and don’t necessarily reflect the individual dynamics of each subset. For instance, in the “New Work Trucks and Vans” dataset, some examples of the subsets included are Service Trucks, Box Trucks and Stripped Chassis. The same is true for all segments: Price, Inventory, DTT, Sales and Mileage.