Key Performance Indicators Report — February 2020

The Brief
Moody’s Investor Service, a credit ratings agency, revised its 2020 outlook for global auto sales in the wake of a coronavirus epidemic—a 2.5% decrease, with China expected to shoulder the biggest brunt of -2.9% as the outbreak worsens. According to CAAM data, Reuters reported that January auto sales in China fell to 18.7%, marking the industry’s 19th consecutive month of sales decline.
The broader impact on China, which has ordered quarantines and taken other steps to contain the epidemic can be seen in the 92% decline in car sales during the first half of February, according to the China Passenger Car Association. Despite cautiously upbeat industry forecasts going forward, the continued spread of the disease leaves plenty of skepticism—and not just in China. Automakers around the world are beginning to feel the pinch, as well. – Paul A. Eisenstein, NBC News
Automakers, as well as aftermarket manufacturers, are feeling the impact. Nissan, which is headquartered in Wuhan, China, plummeted 30% this month. From Tesla, Ford and General Motors to Volkswagen and Hyundai, this is truly a global affair and with such uncertainty, supply chains, economies, as well as international health and safety will continue to be impacted. As of now, organizers of the Geneva Motor Show, scheduled to begin on March 3, have said they plan to go ahead with the annual event but are “carefully observing the situation and its possible implications.”
 Fears of the coronavirus have sent the stock markets into a frenzy. Coupled with a stable but softening economy and the angst of an election year, the annual outlook is unclear.
Improved consumer confidence amid mixed conditions. The U.S. economy experienced an estimated 2.1% real GDP growth in the final quarter of 2019. The growth rate was the same as Q3 and slightly better than consensus estimates. Personal consumption growth slowed to 1.8% from 3.2% in Q3, which was down from 4.6% in Q2. The consumer contribution to growth is slipping. Consumers spent on durable goods, which saw a 2.1% increase in Q4 but down substantially from 8.1% in Q3 and 13% in Q2. Consumer confidence, as measured by the Conference Board, increased 2.1% in January after remaining flat for the prior three months. December’s confidence index was also revised up. The better end to 2019 with the revision and the strong start to January were related to the Phase 1 Trade Deal with China. The January survey was conducted prior to the news breaking about the Wuhan coronavirus. – Manheim
Below is a detailed breakdown of the state of the U.S. economy, manufacturing, new and used vehicle sales, current recalls, a feature on the current wheel and tire market and much more.
Manufacturing ISM
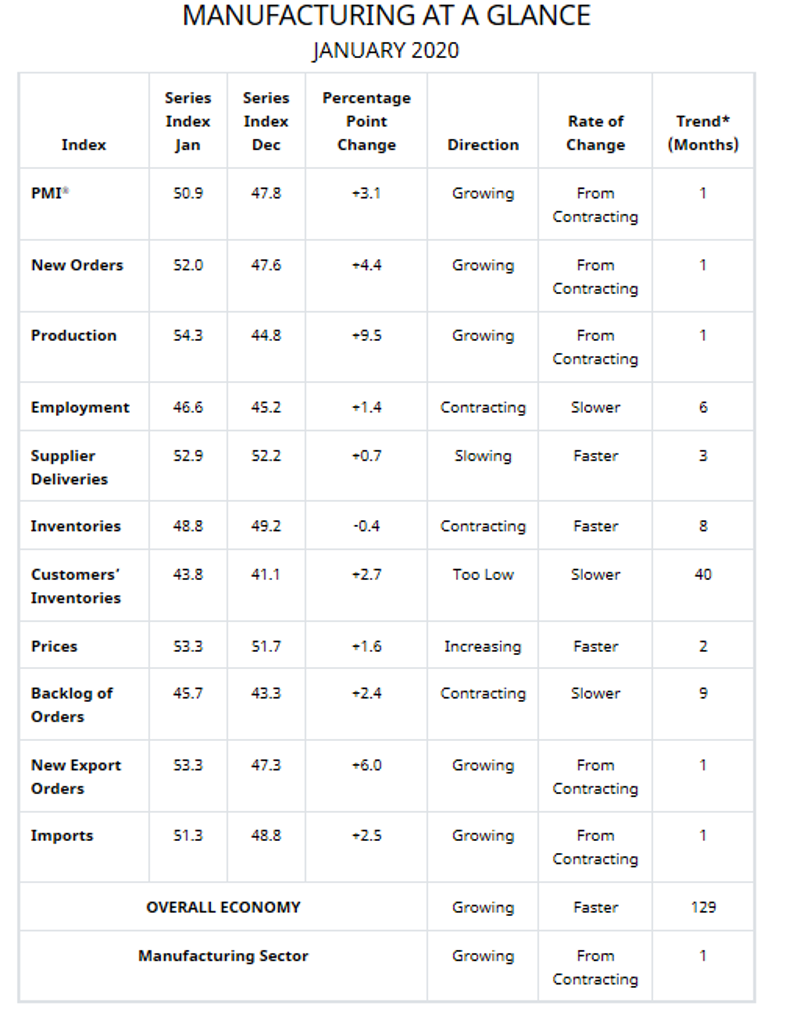
Economic activity in the manufacturing sector grew in January, and the overall economy grew for the 129th consecutive month, say the nation’s supply executives in the latest Manufacturing ISM® Report On Business®. The January PMI® registered 50.9%, an increase of 3.1 percentage points from the seasonally adjusted December reading of 47.8%.
The Report On Business measures its data using the Purchasing Manager’s Index (PMI), which is an indicator of economic health in the manufacturing sector. A reading above 50% indicates that the manufacturing economy is generally expanding, while below 50% indicates that it is generally contracting.
Comments from the panel were positive, with sentiment improving compared to December. The PMI® returned to expansion territory for the first time since July 2019. Inputs—expressed as supplier deliveries, inventories and imports—weakened in January, due primarily to increasing contraction in inventories while supplier deliveries remained in expansion territory, but at a modest rate. Imports expansion returned, but also at a moderate rate. Inputs contributed negatively to the PMI® calculation, a reversal from the previous month. Prices increased for the second month, a positive for 2020. Global trade remains a cross-industry issue, but many respondents were positive for the first time in several months. Among the six big industry sectors, Food, Beverage & Tobacco Products remains the strongest, followed closely by Computer & Electronic Products. Petroleum & Coal Products is the weakest. Overall, sentiment this month is moderately positive regarding near-term growth.” – Timothy R. Fiore, CPSM, C.P.M., Chair of the Institute for Supply Management® (ISM®) Manufacturing Business Survey Committee
Of the 18 manufacturing industries, eight reported growth in January.
- Furniture & Related Products
- Wood Products
- Food, Beverage & Tobacco Products
- Computer & Electronic Products
- Miscellaneous Manufacturing
- Nonmetallic Mineral Products
- Chemical Products
- Fabricated Metal Products
The eight industries reporting contraction in January include the following:
- Printing & Related Support Activities
- Apparel, Leather & Allied Products
- Electrical Equipment, Appliances & Components
- Petroleum & Coal Products
- Textile Mills
- Transportation Equipment
- Primary Metals
- Machinery
- Commodities Up in Price: Aluminum Products* (2), Fabricated Metal Products, Oil, Scrap Metals (2), Steel—Cold Rolled and Steel—Hot Rolled (3)
- Commodities Down in Price: Aluminum Products*, Caustic Soda (4), Freight (4), Natural Gas (2), Polyester and Polypropylene (3)
- Commodities in Short Supply: Fabricated Metal Products and Labor—Temporary
*Indicates both up and down and price. Note: The number of consecutive months the commodity is listed is indicated after each item. The number of consecutive months the commodity is listed is indicated after each item.
New Export Orders*
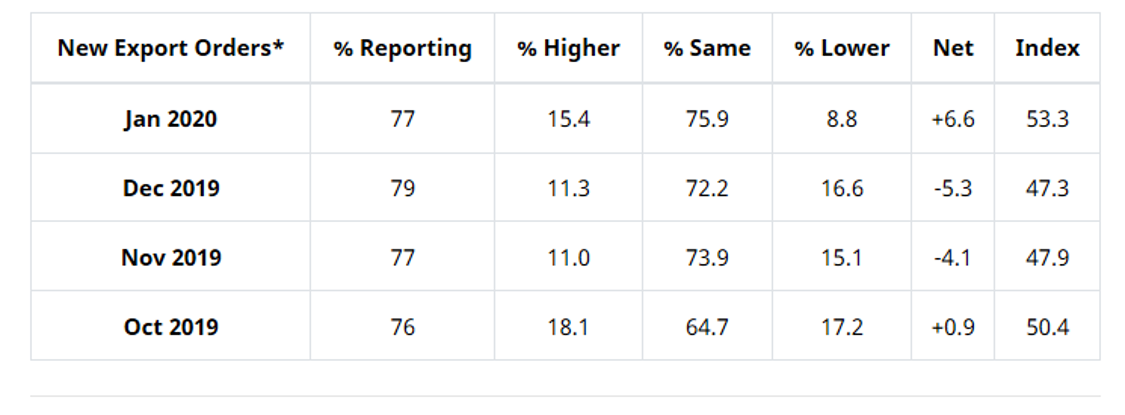
ISM®’s New Export Orders Index registered 53.3%, an increase of 6 percentage points compared to the December reading of 47.3%. After contracting five times in the previous six months, the index moved back into growth. “New Export Orders recorded their best performance since September 2018, when the index registered 56%. This provided positive support to the New Orders Index. Two of the six big industry sectors expanded during the period, with Computer & Electronics Products recording strong performance,” said Fiore.
The six industries reporting growth in new export orders during January include Wood Products, Computer & Electronic Products, Plastics & Rubber Products, Miscellaneous Manufacturing, Paper Products and Chemical Products. The four industries reporting a decrease in new export orders during the same timeframe include Nonmetallic Mineral Products, Fabricated Metal Products, Transportation Equipment and Machinery. Seven industries reported no change in new export orders in January.
Imports*
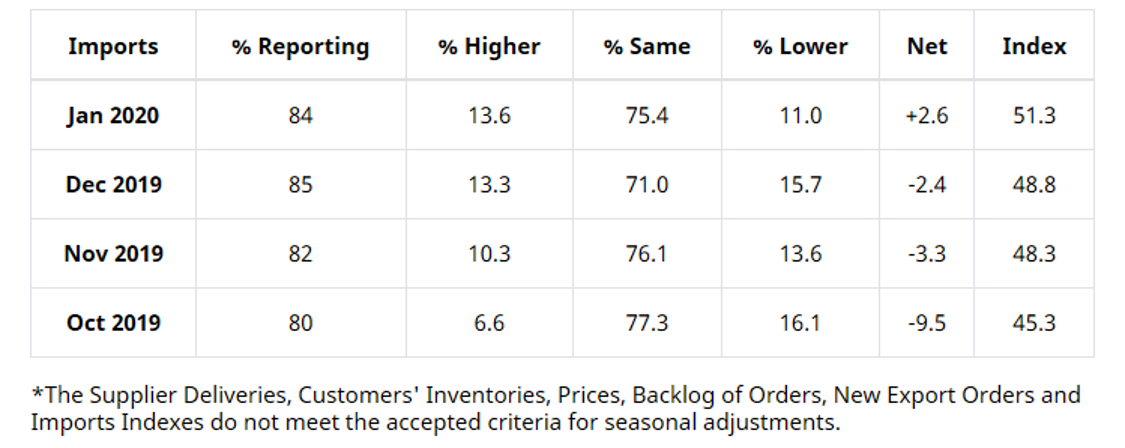
ISM®’s Imports Index registered 51.3%, 2.5 percentage points higher when compared to the 48.8% reported for December. This indicates that imports grew after six consecutive months of contraction. “Imports returned to expansion territory, with the index recording its best performance since February 2019, at 55.3%. Respondents continued to note the Lunar New Year as a significant contributor to improved performance,” added Fiore.
The eight industries reporting growth in imports during January include Wood Products, Printing & Related Support Activities, Furniture & Related Products, Computer & Electronic Products, Nonmetallic Mineral Products, Miscellaneous Manufacturing, Plastics & Rubber Products and Machinery. Conversely, the four industries reporting a decrease in imports during the same period are Primary Metals, Electrical Equipment, Appliances & Components, Chemical Products and Transportation Equipment. Six industries reported no change in imports during January.
State of the Economy
According to the Bureau of Economic Analysis, real gross domestic product (GDP) mirrored third quarter results by increasing at an annual rate of 2.1% during the fourth quarter of 2019. This increase reflects positive contributions from personal consumption expenditures (PCE), federal government spending, state and local government spending, residential fixed investment, as well as exports, but is partly offset by negative contributions from private inventory investment and nonresidential fixed investment.
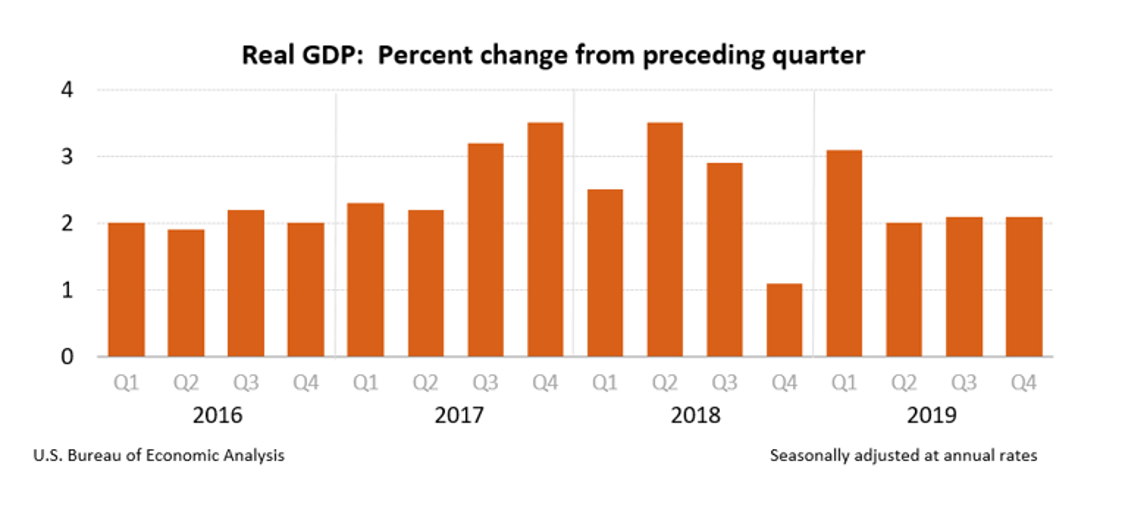
“In the fourth quarter, a downturn in imports, an acceleration in government spending and a smaller decrease in nonresidential investment were offset by a larger decrease in private inventory investment and a slowdown in PCE,” explained the Bureau of Economic Analysis. Other important takeaways, courtesy of the Bureau of Economic Analysis:
• Real GDP increased 2.3% year-over-year during the fourth quarter. That compared with an increase of 2.5% during 2018. The price index for gross domestic purchases, as measured from the fourth quarter of 2018 to the fourth quarter of 2019, increased 1.5% during 2019. That compared with an increase of 2.2% during 2018. The PCE price index increased 1.5%, compared with an increase of 1.9%. Excluding food and energy, the PCE price index increased 1.6%, compared with an increase of 1.9%. The price index for gross domestic purchases increased 1.6% in 2019, compared with an increase of 2.4% in 2018. The PCE price index increased 1.4%, compared with an increase of 2.1%. Excluding food and energy prices, the PCE price index increased 1.6%, compared with an increase of 1.9%.
• Current dollar GDP increased 3.6%, or $191.7 billion, in the fourth quarter to a level of $21.73 trillion. In the third quarter, GDP increased 3.8%, or $202.3 billion. Current dollar GDP increased 4.1%, or $848.8 billion, in 2019 to a level of $21.43 trillion, compared with an increase of 5.4%, or $1,060.8 billion, in 2018.
• Current-dollar personal income increased $148.7 billion in the fourth quarter, compared with an increase of $162.6 billion in the third quarter. The smaller increase reflected decelerations in proprietors’ income, personal current transfer receipts and personal dividend income, which were partly offset by a smaller decrease in personal interest income and an acceleration in compensation.
• Disposable personal income increased $127.4 billion, or 3.1%, in the fourth quarter, compared with an increase of $179.5 billion, or 4.5%, in the third quarter. Real disposable personal income increased 1.5%, compared with an increase of 2.9%.
• Personal saving was $1.29 trillion in the fourth quarter, compared with $1.30 trillion in the third quarter. The personal saving rate—personal saving as a percentage of disposable personal income—was 7.7% in the fourth quarter, compared with 7.8% in the third quarter.
• Overall, real GDP increased 2.3% during 2019, compared with an increase of 2.9% the year prior. The deceleration in real GDP in 2019, compared to 2018, primarily reflected decelerations in nonresidential fixed investment and PCE and a downturn in exports, which were partly offset by accelerations in state, local and federal government spending. Imports increased less in 2019 than in 2018.
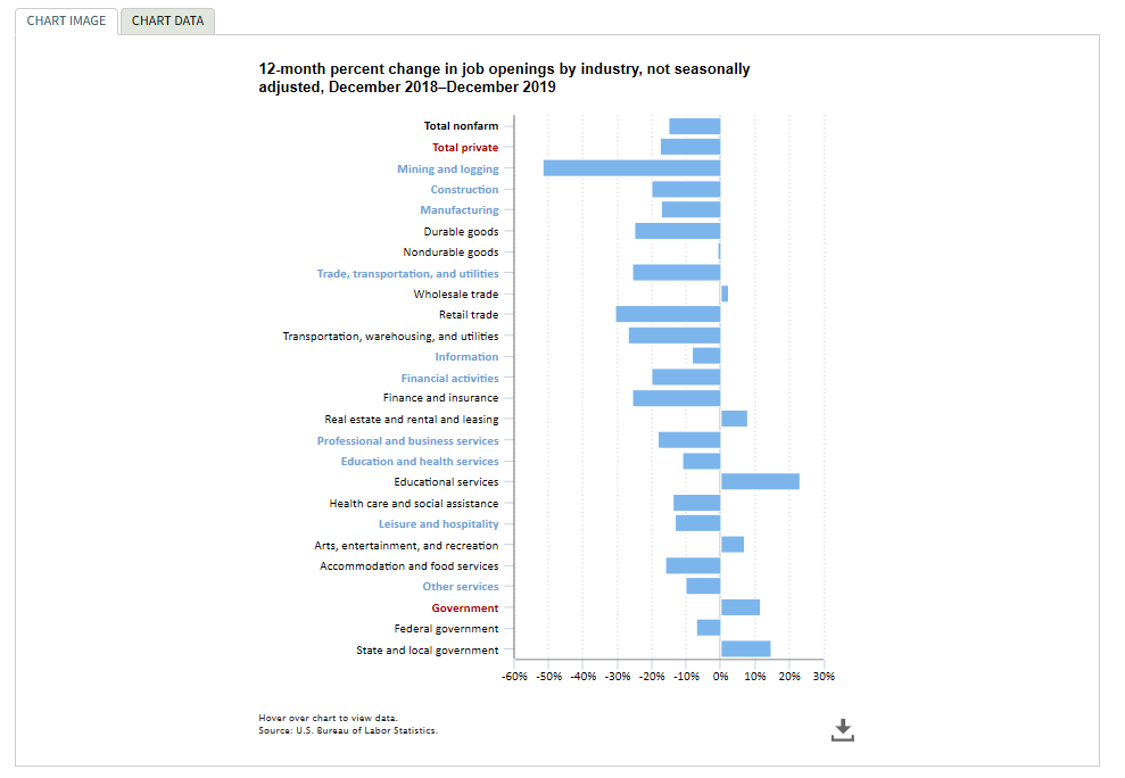
Capping off the fourth quarter, December marked the 22nd consecutive month that there were more job openings than job seekers, according to the Bureau of Labor Statistics. On the last business day of December 2019, there were 5,892,000 job openings, a decrease of 14.9% from prior year. For private industry, job openings on the last business day of December 2019 were 5,221,000, representing a 17.4% decrease.
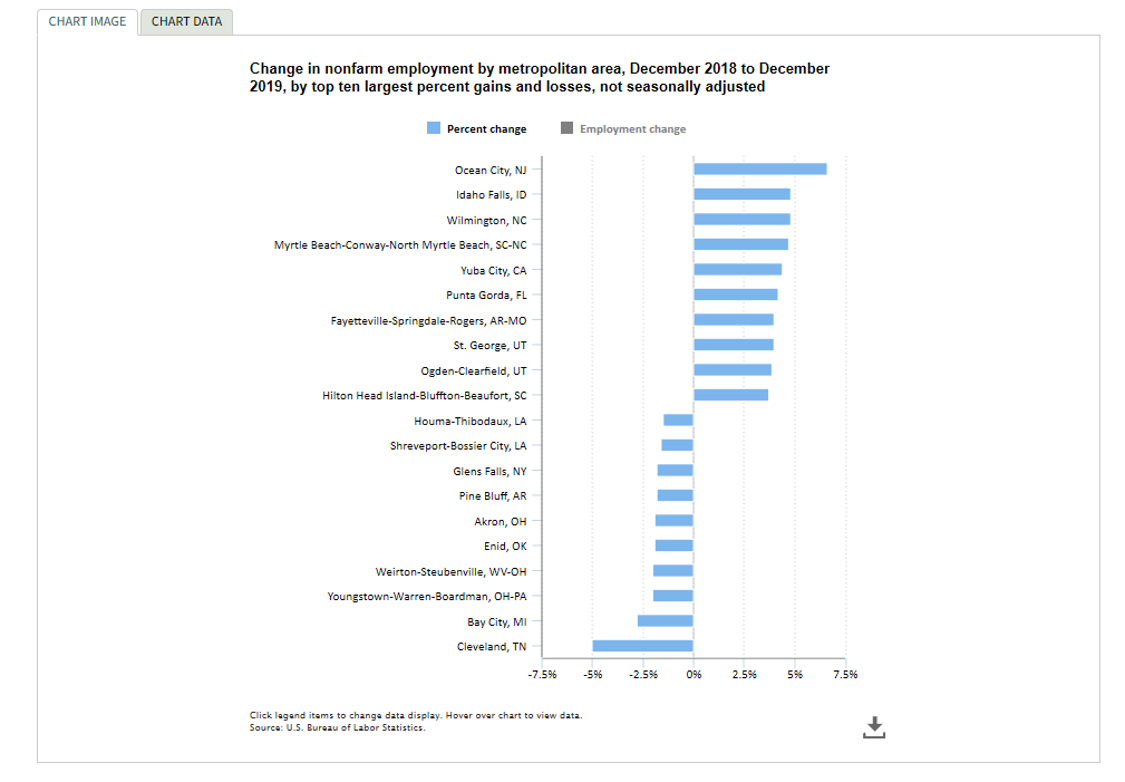
During this period, 45 metro areas experienced increases in nonfarm employment and 344 were essentially unchanged. The largest statistically significant year-over-year percentage increases in employment occurred in Idaho Falls, Idaho and Wilmington, North Carolina at 4.8% each, as well as Myrtle Beach-Conway-North Myrtle Beach and South Carolina-North Carolina, which registered at 4.7%. The largest year-over-year employment increases occurred in Dallas-Fort Worth-Arlington, Texas (127,600), New York-Newark-Jersey City, NY-NJ-PA (97,300) and Los Angeles-Long Beach-Anaheim, California (93,200).
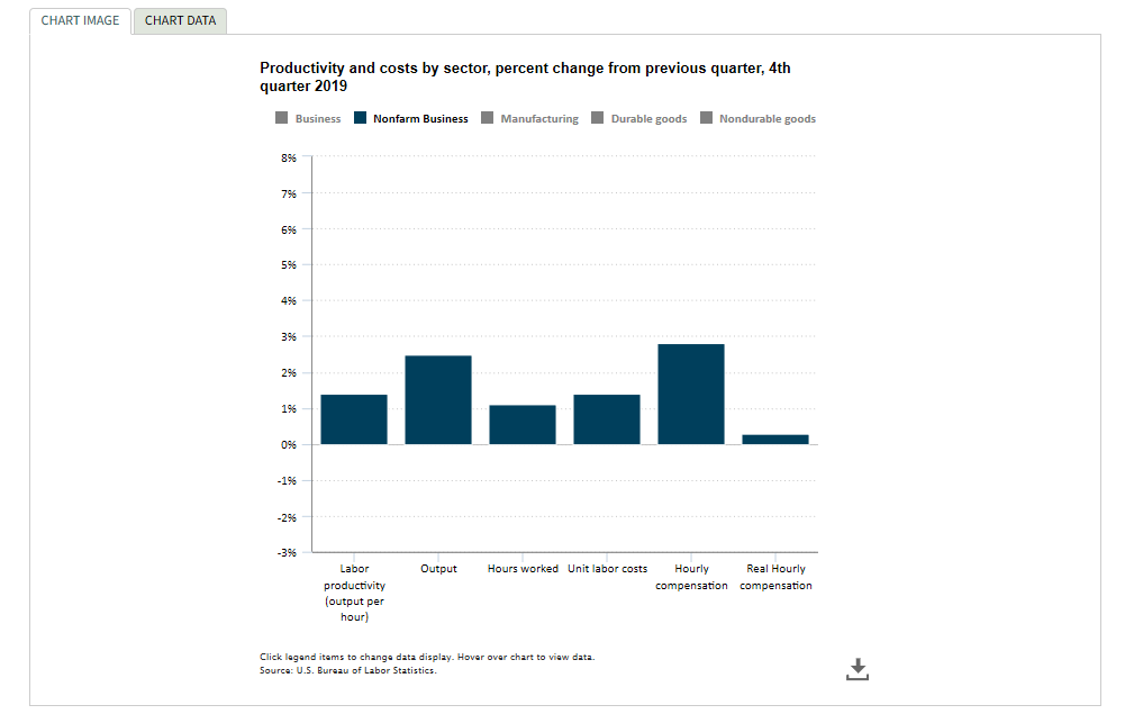
In addition to job growth, nonfarm business sector labor productivity increased 1.4% during the fourth quarter of 2019, as output increased 2.5% and hours worked increased 1.1%. Unit labor costs in the nonfarm business sector increased 1.4%, as hourly compensation outpaced productivity at 2.8%.
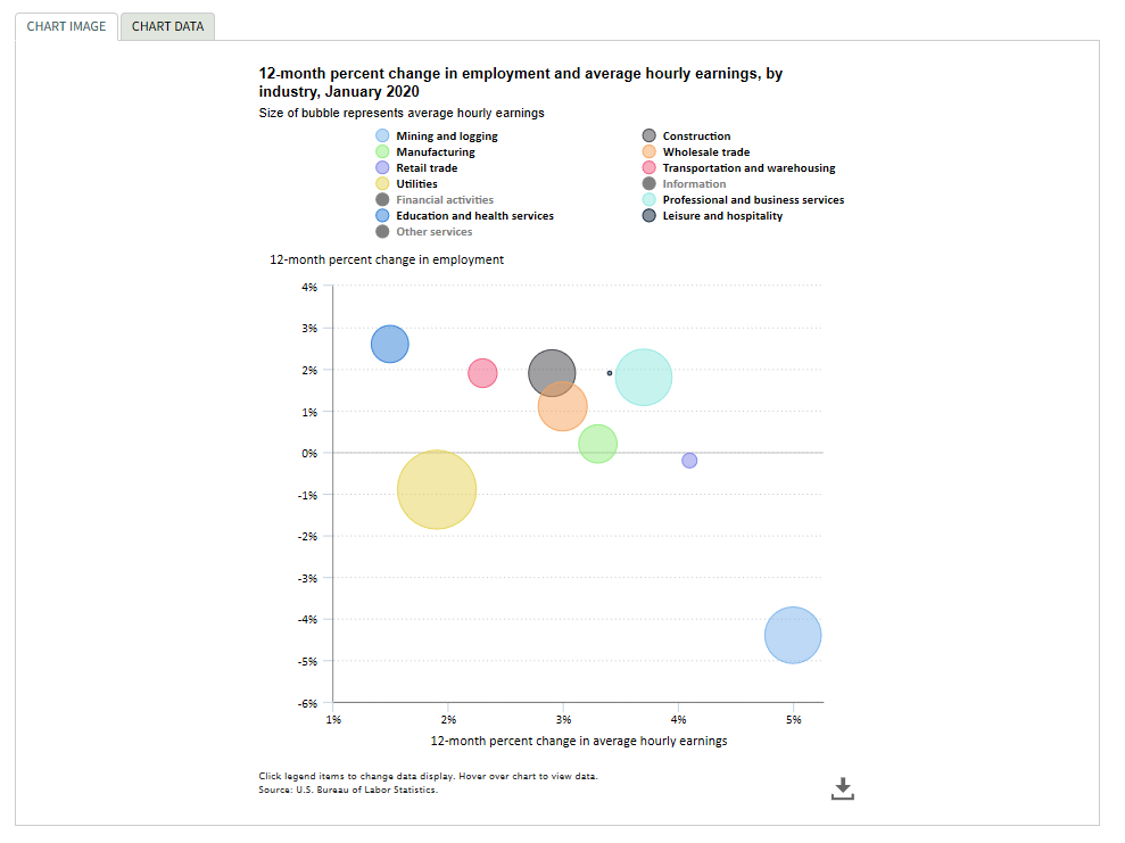
The upward trend in employment continues, with the U.S. economy adding 225,000 new jobs during January, according to the Bureau of Labor Statistics.
“January’s jobs report far surpassed expectations with a surge of 225,000 jobs created. For the 23rd consecutive month, the unemployment rate was at or below 4%. At 3.6%, the unemployment rate ticked up slightly as more Americans entered the labor force. The labor force participation rate moved up to the highest point since 2013,” said U.S. Secretary of Labor Eugene Scalia. “Wages have increased by 3% or more for 18 consecutive months after December revisions and another strong performance in January. Production and non-supervisory wages increased even faster than managers’, continuing the blue-collar boom,” he added. “Today, the Bureau of Labor Statistics also released the annual benchmark revisions, and the readjusted number of jobs created since January 2017 is 6.6 million. After today’s report and revisions from November and December, the trends in the economy are clearly positive,” explained Scalia.
Among major worker groups, the unemployment rates were as follows: adult men 3.3%, adult women 3.2%, teenagers 12.2%, Whites 3.1%, Blacks 6%, Asians 3% and Hispanics 4.3%. Other important takeaways from January reporting:
- Construction employment rose by 44,000. Most of the gain occurred in specialty trade contractors, with increases in both the residential (+18,000) and nonresidential (+17,000) components. Construction added an average of 12,000 jobs per month in 2019.
- Health care added 36,000 jobs, with gains in ambulatory health care services (+23,000) and hospitals (+10,000). Health care has added 361,000 jobs over the past 12 months.
- Employment in transportation and warehousing increased by 28,000. Job gains occurred in couriers and messengers (+14,000) and in warehousing and storage (+6,000).
- Over the year, employment in transportation and warehousing has increased by 106,000.
- Employment in leisure and hospitality continued to trend up in January (+36,000). Over the past 6 months, the industry has added 288,000 jobs.
- Employment continued on an upward trend in professional and business services as well (+21,000), increasing by 390,000 over the past 12 months.
- Manufacturing employment changed little during this timeframe (-12,000) and has shown little movement, on net, over the past 12 months. Motor vehicles and parts lost 11,000 jobs over the month.
- Employment in other major industries, including mining, wholesale trade, retail trade, information, financial activities and government all experienced little change over the month.
The Voice of Consumers
The Conference Board Consumer Confidence Index® experienced a boost during January, following a moderate increase the month prior. “Consumer confidence increased in January, following a moderate advance in December, driven primarily by a more positive assessment of the current job market and increased optimism about future job prospects,” said Lynn Franco, Senior Director, Economic Indicators, at The Conference Board. “Optimism about the labor market should continue to support confidence in the short-term and, as a result, consumers will continue driving growth and prevent the economy from slowing in early 2020.”
Low unemployment, healthy job gains and stability in the housing market are up against volatile vehicle markets, a coronavirus epidemic and an unarguably heated U.S election year. Other consumer-level expert feedback includes:
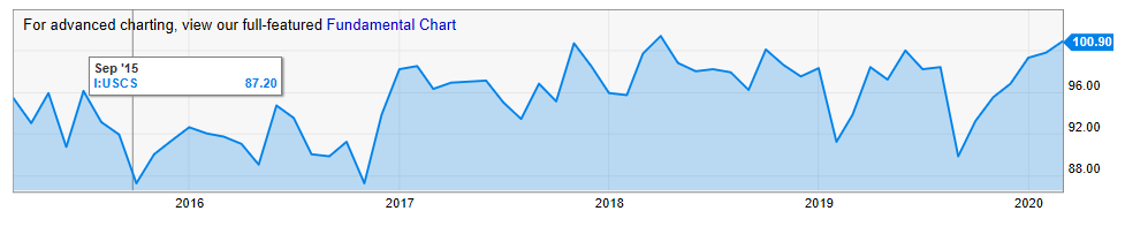
• Consumer sentiment remains at positive levels, with the January reading of 99.8 insignificantly below the cyclical peak of 101.4, according to the University of Michigan Surveys of Consumers. “The maintenance of consumer sentiment near cyclical peak levels is surprising given the overall slow pace of economic growth, which was accompanied in January by renewed military engagements in the Mideast, an impeachment trial in the Senate and a fast spreading coronavirus,” stated U-M economist Richard Curtin, director of the surveys. “The resilience of consumers is remarkable and due to record low unemployment, record gains in income and wealth, as well as near-record lows in inflation and interest rates,” he said. At the time of publishing, consumer spending is expected to expand the economy in 2020, although at a moderate pace.
“The most surprising finding in January was the degree of resiliency displayed by consumers in the face of a variety of events that in the past have prompted at least a rise in uncertainty if not outright pessimism. These concerns were offset by the favorable assessments of household income and wealth, which matched prior peaks in 2000 and 1966. Resilience in the face of recent events is unlike confronting potential shifts in basic economic policies. As the presidential primaries get underway, consumers may confront fundamental changes in tax and spending programs that could reshape the financial prospects for most American households.” – U-M economist Richard Curtin, director of the surveys
Similar to January, consumer sentiment increased to 100.9 in early February—nearly matching the expansion peak of 101.4, which was set two years ago in March 2018. The Expectations Index, the main gauge of future economic conditions, rose to 92.6—also its second highest level during this long expansion.
Read full reporting here and here.
• The Consumer Price Index for All Urban Consumers (CPI-U) rose 0.1% during January (on a seasonally adjusted basis) after increasing 0.2% in December, according to the U.S. Bureau of Labor Statistics. The index for shelter accounted for the largest part of the increase, with the indexes for food and medical care services also rising. These increases more than offset a decrease in the gasoline index, which fell 1.6% in January. Also important to note:
– The energy index declined 0.7%, and the major energy component indexes were mixed.
– The index for food rose 0.2% during the reporting period, with the indexes for both food at home and food away from home increasing over the month.
– The index for all items less food and energy rose 0.2% in January after increasing 0.1% in December.
– Along with the indexes for shelter and medical care, the indexes for apparel, recreation, education and airline fares all increased in January.
– The indexes for used cars and trucks, prescription drugs, motor vehicle insurance and household furnishings and operations were among those to decline.
– The all items index increased at a rate of 2.5% year-over-year during January, which is the largest 12-month increase since the period ending October 2018. The index for all items less food and energy rose 2.3% over the last 12 months, the same 12-month increase as reported in the previous 3 months. The food index rose 1.8%, while the energy index increased 6.2% over that period.
• U.S. retail sales increased a modest 0.3% during January, a slight improvement over December. “However, economists were also expecting to see a solid gain in an underlying control group of retail sales which feeds into the government’s calculations for overall economic growth. Instead, sales in the control group showed no gain at all in January and the December performance was revised down to show a gain of just 0.2%, slower than the 0.5% rise initially reported. Economists said the weakness in underlying retail sales was disappointing but likely will be temporary given a number of factors expected to support consumer spending in coming months,” reported AP News. The good news, according to Andrew Hunter, senior U.S. economist at Capital Economics, “With jobs growth solid and consumer confidence resilient, we doubt this weakness will persist.
New and Used Vehicle Information
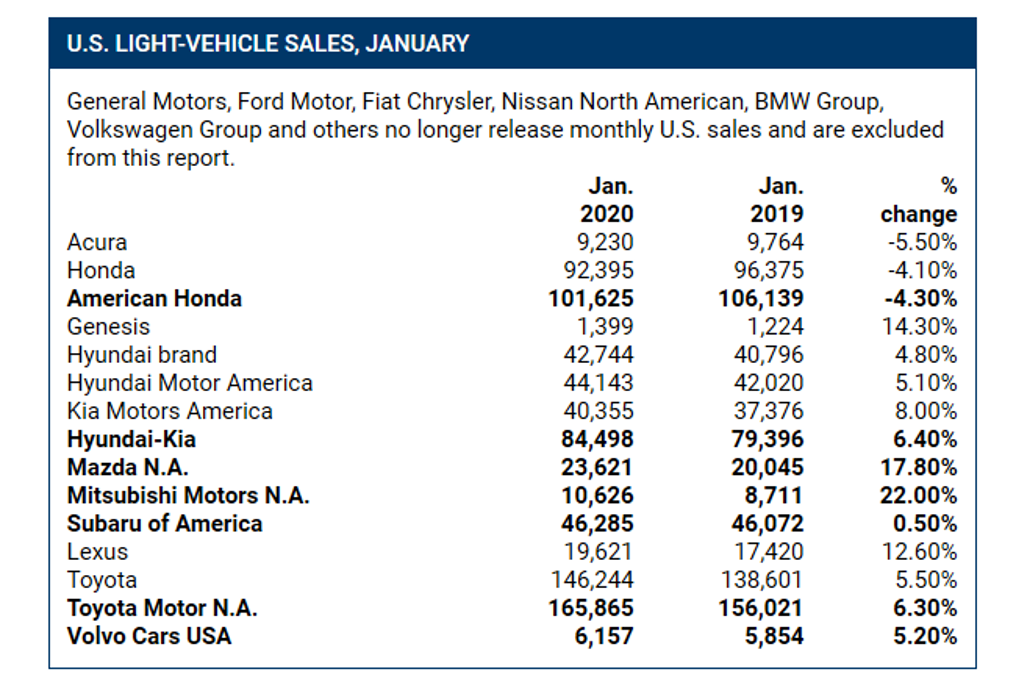
The totals are in and they’re, well, underwhelming. According to Manheim, January new vehicle sales were down 0.2% year-over-year, while the SAAR registered at 16.8 million, an increase from last year’s 16.7 million and up from December’s 16.7 million rate. New vehicle inventories came in under 3.5 million units.
Cox Automotive points out that many automakers didn’t hit their forecast, with FCA and Nissan dipping well below projections. General Motors and Ford, approximately 30% of the U.S. vehicle market, are now reporting on a quarterly basis—despite grumblings from the crowd. Though, considering current reports and analysis, “Our team believes General Motors finished January near forecast of down 6.8%. Leaked reports indicate Ford delivered a positive surprise in January, with sales up over 7%, well above forecast,” according to the January 2019 U.S. Automotive Sales report.
January proved to be weaker than anticipated for Fiat Chrysler, up only 2%. In contrast to previous months when Jeep was the champ, Ram saved the day in January with pickup sales up 19%. The redesigned Ram 1500 pickup, which had lower incentives than its prime competitors, has been winning critical acclaim and awards, including the North American Truck of the Year presented at the Detroit auto show in January. – Michelle Krebs, Executive Analyst, Autotrader
Combined rental, commercial and government purchases of new vehicles were down 5.3% year-over-year during January, while commercial vehicle sales were up 3.7% year-over-year. Retail sales of new vehicles were up 1%, leading to a retail SAAR of 13.8 million, an increase from 13.5 million last January and down from December’s 14.2 million rate.
FCA saw a modest year-over-year gain in January driven entirely by fleet. Fleet sales increased 50% in January, accounting for 23% of total monthly sales. As a comparison, fleet share in January 2018 was 16% of total sales, far below FCA’s typical average. So even though fleet sales increased significantly in a narrow year-over-year comparison, fleet share was consistent with FCA’s full-year 2018 fleet share of 21%. – From Zo Rahim, Research Manager, Cox Automotive
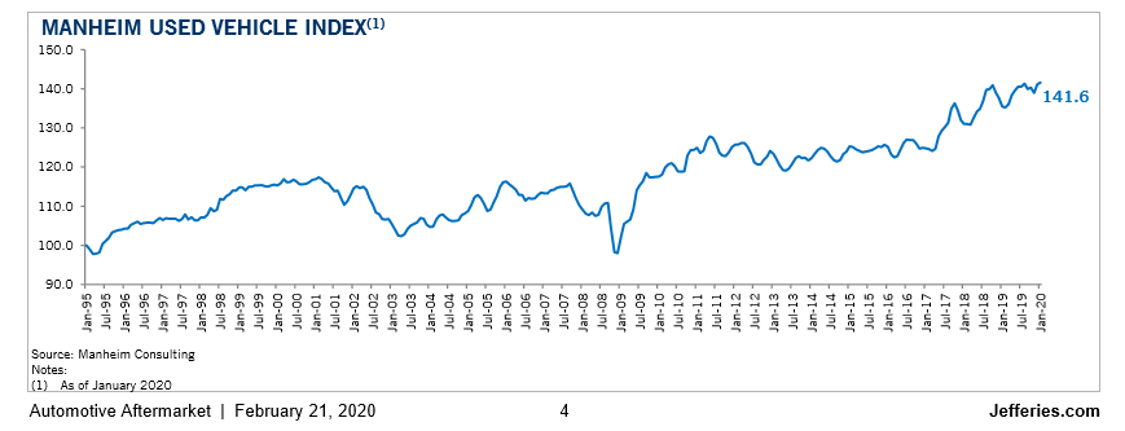
On the contrary, albeit a small increase, wholesale used vehicle prices (on a mix-, mileage- and seasonally adjusted basis) did experience a small uptick of 0.39% month-over-month in January. This brought the Manheim Used Vehicle Value Index to 141.6, a 4.6% increase from a year ago, setting a record high for the Index.
“Following a normalizing trend in weekly Manheim Market Report (MMR) prices at the end of 2019, January saw steady prices as expected. Three-year-old vehicle values in aggregate were down 0.2% for the month. Non-luxury vehicles in aggregate saw no decline, while luxury vehicles in aggregate saw a decline of 0.7% for the month, which is in line with historical performance. This January’s normal trend for prices was a marked improvement over last year’s declines. On a year-over-year basis, most major market segments saw seasonally adjusted price increases in January. Luxury cars outperformed the overall market, while most other major segments underperformed the overall market.” – Manheim
According to Cox Automotive, total used vehicle sales volume saw a 2.8% year-over-year boost. Manheim estimates the January used SAAR to be 39.5 million, up from 38.8 million last January but down from December’s 40 million rate. The January used retail SAAR estimate is 20.7 million, up from 19.8 million last year and up month-over-month from December’s 20.1 million rate.
February 2020 Vehicle Recalls
2020 Jeep Wrangler
- Vehicles Affected: Approximately 3,000 model-year 2020 Jeep Wrangler SUVs
- The Problem: The left-side lower control arm bracket and weld may not be correctly positioned, potentially allowing the lower control arm to separate from the axle and increasing the risk of a crash.
- The Fix: Dealers will inspect the front axles and replace them, as necessary, for free.
2018-2020 Ford F-150
- Vehicles Affected: Approximately 166,200 model-year 2018-20 Ford F-150 pickup trucks with LED headlights
- The Problem: With the daytime running lamps on, affected vehicles are illuminated and the master lighting switch is manually rotated from the autolamp position to the headlamp-on (low-beam) position. The daytime running lights remain activated instead of dimming to parking lamp intensity, reducing the visibility of other drivers and increasing the risk of a crash. Ford said it is not aware of any reports of accident or injury related to this condition.
- The Fix: Dealers will update the body control module software configuration for free.
2015-2016 Ford F-150
- Vehicles Affected: Approximately 13,800 model-year 2015-16 Ford F-150 pickup trucks equipped with engine heater elements and 3.5-liter GTDI engines
- The Problem: Depending on the heater element location, some trucks may have cables with insufficient heat protection and incorrect length. Prolonged exposure to high temperatures can cause a resistive short, inoperative engine block heater or tripping of household breakers or GFCI-equipped outlets while the truck is parked and the block heater is plugged in. Ford said the risk to safety exists only while the vehicle is parked and the block heater cable is plugged into an electrical outlet. A resistive short in the engine-block heater splice connector can increase the risk of overheated or melted wiring and fire. Ford also said it is not aware of any reports of fire, accident or injury related to this condition.
- The Fix: Dealers will inspect the block heater and cable, and repair or replace as necessary for free.
2019 Chevrolet Silverado 1500, GMC Sierra 1500
- Vehicles Affected: Approximately 148,000 model-year 2019 Chevrolet Silverado 1500 and GMC Sierra 1500 pickup trucks
- The Problem: Affected trucks received updated software for the electronic brake control module that has an error that may disable the electronic brake assist, increasing the risk of a crash.
- The Fix: Dealers will reprogram the electronic brake control module for free.
2019-2020 Ram 2500, 3500
- Vehicles Affected: Approximately 84,200 model-year 2019-20 Ram 2500 and 3500 heavy-duty pickup trucks equipped with six-speed automatic transmissions
- The Problem: A build-up of pressure and heat inside the transmission may result in a transmission fluid leak from the dipstick tube, which may contact the turbocharger or another ignition source within the engine compartment, increasing the risk of a fire.
- The Fix: Dealers will replace the transmission valve body separator plate and reprogram the powertrain control module for free.
2020 Mercedes-Benz, Mercedes-AMG Cars and SUVs
- Vehicles Affected: Approximately 240 model-year 2020 Mercedes-Benz C-Class and E-Class cars and GLC-Class SUVs, and model-year 2020 Mercedes-AMG C43, C63, CLS53, GT63, GT63S cars and GLC63 SUVs
- The Problem: An electrical circuit inside the eCall emergency call system communication module may be damaged, potentially relaying an inaccurate vehicle location that may delay emergency responders, increasing the risk of injury.
- The Fix: Dealers will replace the communication module for free.
2015-2016 Tesla Model X
- Vehicles Affected: Approximately 14,100 model-year 2015-16 Tesla Model X SUVs
- The Problem: The aluminum bolts that attach the power steering gear assist motor to the gear housing may corrode and fracture, causing a reduction or complete loss of power steering assist and increasing the risk of a crash.
- The Fix: Tesla Service Centers will replace the steering gear mounting bolts with coated steel bolts, and add a corrosion-preventive sealer to the steering gear motor housing and motor connection bolts. If the mounting bolts are found to be broken or break during removal and cannot be removed, a new steering gear will also be installed. All repairs will be done for free.
2020 Honda Passport, Pilot
- Vehicles Affected: Approximately 10,000 model-year 2020 Honda Passport and Pilot SUVs
- The Problem: The certification label may have been printed with ink that can be wiped away with a solvent, removing the gross axle weight rating and gross vehicle weight rating information, increasing the risk of overloading and a crash.
- The Fix: Dealers will replace the certification label for free.
2016 Mazda CX-5
- Vehicles Affected: Approximately 36,760 model-year 2016 Mazda CX-5 SUVs
- The Problem: LED daytime running lights may flicker or fail to illuminate while driving.
- Due to an inappropriate material specification of the sealing gasket attached to the LED daytime running light wiring connector, the gasket can release sulfur, which may corrode the LED circuit controlling the lights and flicker or fail to illuminate while driving, increasing the risk of a crash. Mazda said it is not aware of any related accidents or injuries.
- The Fix: A remedy is not yet available.
*All recall information is courtesy of Cars.com
Automotive Aftermarket
In the previous Key Performance Indicator Report, Tyson Boyer of Dill Air Controls Products LLC and current Wheel & Tire Council (WTC) Chair at SEMA was quoted as saying, “The wheel and tire marketplace continues to face challenges. Some of these challenges can be attributed to the slowed growth in new-car sales, major mergers and acquisitions over the last few years, variable raw materials costs and global economic and trade uncertainties, most notably the continued increases in tariffs. These are causing manufacturers in our space to redefine company goals and, in some cases, put a hold on their aggressive expansion plans. This means you cannot sit still because the change-opportunity time is ripe.”
He continued by emphasizing the importance of collective brainstorming for new sales techniques and suggesting that shop owners “transform B2C product offerings, engage in alternative training, dissect technology in-house and on the e-commerce side, as well as the team’s aptitude in order to constantly deliver beyond the customer’s expectations.”
From an external standpoint, he recommended giving the business model a fresh look, while updating customer value propositions to adapt to the rapidly changing digital space. “Analyze your partnerships and sourcing strategies. Trust your gut and do not hold back on taking the calculated risk move,” he said.
Given the spring wheel and tire selling season is upon us, Dan Guyer, Category Manager of Wheels and Tires at Keystone Automotive, elaborated on the evolution of the market segment by providing readers with a few additional key points about the topic.
Q: In what ways has the wheel industry changed in the past decade—how has the consumer changed and the means by which you reach and connect with that customer? How does that play into your plan/approach for the new decade to come?
A: Well, it’s nothing like it used to be. There are just soo many choices. Size, finishes, machining, colors, deep lip, concave, cast, forged, monoblock, flow-formed—and the list goes on. The consumer has a dizzying array of options, and there are a lot of new names out there, too.
Additionally, the consumer has more ways than ever to research and buy online. Our job as a leading WD is to find creative ways to connect with consumers through the valued partnerships we have at the shop and supplier level. One example is our new Interactive Garage feature, a virtual custom vehicle build visualizer that’s part of eKeystone.com.
Yet another thing we can’t forget is that consumer demand is driven by social media. It’s easier than ever before to scroll through a feed, find something that catches your interest and say, “THAT! I want THAT!” Together, we as an industry have to be ready and willing to serve the immediate gratification of the consumer.
Q: What is the current state of business for the wheel industry right now?
A: It’s a challenge. The tariffs and subsequent tariff reductions played havoc with pricing and inventory. A 20×10 wheel is now tariffed at 15% less than a 20×9. Insanity.
The WP acquisition of MHT changes everything, too. You took #1 and #2 (by a long margin) and combined them into a giant.
Not to mention, the wheel and tire market is very dependent on new truck sales. If we see a downturn in the economy or a big change in fuel prices, it all can change overnight. We’ve seen smaller wheel brands go OOB because the tariffs simply made their wheels too expensive. A lot of manufacturers are looking at secondary sourcing outside of China now as well—not only because of the trade situation, but also growing concerns connected to the coronavirus. The market is in a state of flux due to uncertainty.
Q: Anticipating trends and consumer demand must be challenging. How can/do brands stay ahead of the curve in such a fast-paced industry where styling preferences are constantly evolving?
A: You’re seeing brands do a ton of styles with smaller inventories. They design what they think will sell and try to react quickly with larger quantities if it resonates well with consumers, but should a wheel design fail, it’s less of a financial risk.
“The market changes very rapidly. What was hot last year, definitely isn’t hot this year and obviously, what’s hot next year is going to be different from what we do right now. As a company, we do about 30+ events here in the U.S. and about 10+ overseas. Our marketing team goes and talks to people, sees the customers and what they bring to the shows, to see what’s hot, what the customer wants. Sometimes, our engineers tag along to get a better idea of why certain popular vehicles look good—what exactly are the trends emerging? Having a presence at the show really allows us to relay that message from what the customer wants to what we can provide as a next generation trend.” – Lawrence Lee, vice president of GRID Off-Road
Q: Speaking of trends, can you discuss a few of the exciting trends coming out of SEMA—consumer/shop feedback, interesting styles and some of the new wheel designs that are appealing to you?
A: I’d say two highlights. The CUV crowd got some real love! There were tons of new wheels and more aggressive tires for these vehicles. And Mickey Thompson brought out the big guns, with the huge expansion of the Baja Pro XS and the expansion of the Boss competition tread.
“For us, small details really matter—and that comes from our Savini experience. For example, right now we’re offering insert options for certain wheels, that can be switched out for a new look or come off so you can rotate the tires. Additionally, our wheels feature a two-piece center cap design, where you can actually open up the cap to easily access the manual hub lockout. Plus, where other manufacturers use plastic caps, our two-piece forged off-road wheels come with a forged cap to keep it more in line with the customers’ demands. Things like that make us a little different than other offerings on the market.” – Lawrence Lee, vice president of GRID Off-Road
Q: Any insight into which wheel markets you expect to do particularly well in 2020 and why?
A: The market will still lean heavily on truck and Jeep, but the emerging CUV segment is exciting.
“For GRID Off-Road specifically, we’re launching new UTV wheels with Keystone. It’s been a really successful, growing market so we’re targeting it with some new designs and multiple colors.” – Lawrence Lee, vice president of GRID Off-Road
March Trade and Auto Shows
- Detroit Autorama – February 28 – March 1 (Detroit, MI)
- Lucas Oil Off-Road Expo – March 2-3 (Scottsdale, AZ)
- NTEA Work Truck Show – March 3-6 (Indianapolis, IN)
- Kansas City Auto Show – March 4-8 (Kansas City, MO)
- Rochester Auto Show – March 5-8 (Rochester, NY)
- OKC Auto Show – March 6-8 (Oklahoma City, OK)
- Geneva Int’l Motor Show – March 5-15 (Geneva, Switzerland)
- Twin Cities Auto Show – March 7-15 (Minneapolis, MN)
- Auto Calgary – March 11-15 (Calgary, Alberta)
- Tri-State Auto Exhibition – March 14-15 (Denver, CO)
- Lehigh Valley Auto Show – March 19-22 (Bethlehem, PA)
- Columbus Int’l Auto Show – March 19-22 (Columbus, OH)
- Vancouver Auto Show – March 25-29 (Vancouver, BC)
- 2020 Mid-America Trucking Show – March 26-28 (Louisville, KY)
- Keystone BIG Show – March 27-28 (Grapevine, TX)
- Zagreb Auto Show – March 31- April 5 (Dubrovnik, Croatia)