Key Performance Indicators Report — January 2020

The Brief
Back in January 2019, Cox Automotive estimated domestic light-duty vehicle sales to top out at 16.8 million for the year. Well, the tally is in and for the fifth consecutive year, Automotive News confirmed U.S. auto sales surpassed the 17 million mark—by a hair. The industry may have reached its vehicle target, but totals are down 1.2% from 2018.
Trucks, SUVs and crossovers were the big winners in 2019, but don’t count the sedan down and out just yet. “Brands like Hyundai, Kia, Honda, Toyota, Subaru, virtually every German badge and even Captain of the Corporate Struggle Bus: Nissan, see the Big Three’s withdrawal from the segment as an invitation,” according Only the Strong Survive: Best Sedans for 2020. Consumers may have the power of choice, but high vehicle transaction prices and congested segments with umpteen models to choose from make it challenging for dealerships to move the new inventory quickly.
OEMs are expected to launch a whopping 246 new models from 2020-2023, at an average of 62 per year. That’s more than 50% above the average number launched in the preceding 20 years – Car Wars, an annual report by Bank of America Merrill Lynch
In fact, CNBC reported that approximately 3.5% of all car sales in July 2019 were 2018 models—the highest percentage of new car sales of older models since at least 2005. Even longtime favorites like the Jeep Wrangler, which posted a 5% loss during 2019, are spending unprecedented time on dealer lots.
“As new vehicles become more durable, lasting longer between trade-ins, they’re also becoming eye-wateringly more expensive. And this, by default, encourages consumers to extend ownership time just a little further, in the hopes of staving off burdensome monthly payments,” according to Michele Boyarsky, author of A Year in Review: 2019 Auto Sales Totals and 2020 Predictions.
Valuation analysts at Kelly Blue Book put the estimated average transaction price for a light-duty vehicle in the U.S. at $38,948 as of December 2019. That’s up 1.7% from the same time last year, or an average of approximately $650.
“Cheap and available credit, low unemployment rates and healthy consumer sentiment all contributed to a robust market for U.S. auto sales in 2019,” commented CNBC, but what’s in store for the decade ahead? Increasing consumer expectations, connected technology, rising loan prices, a pivotal presidential election and an infatuation with electric and autonomous vehicles will shape the automotive industry, according to a recent Cars.com report.
Joe Wiesenfelder, executive editor of Cars.com and a 25-year automotive expert, advises on the next decade of automotive trends:
• Car shoppers will begin to see e-commerce collide with the in-store experience. We anticipate most of the vehicle transaction will move online in the next decade, but shoppers will still be working with dealers—it just may look different than it does today. I can see a world where we’re going to the local dealership to check out the latest in-car tech, much like we go to the Apple Store to experience the latest smartphone.
• Consumers have willingly taken on more debt when it comes to buying a new car but shouldn’t be fooled into thinking there are no other options. This is the “upgrade generation” where consumers are used to upgrading to the latest tech and devices every couple of years. That, coupled with smaller monthly payments, should lead to more leased vehicles. And certified pre-owned cars are an excellent option for consumers looking for a new-car alternative and great value.
• I think we will see more high-tech integration into cars to meet the needs of the changing consumer. We expect our electronics to be automatically updated and fully connected and it’s not a far cry to expect the same from our cars. A couple of manufacturers are already doing this, and we anticipate additional automakers will follow suit. It could ultimately lead to an “immortal” car being born, but that would require a fundamental change in philosophy from the current model, which is planned obsolescence and replacement.
• Electric vehicles are closer to mainstream adoption than autonomous vehicles, but you should temper any future expectations you have for either them.
• It’s a misconception to assume that a presidential election will directly impact auto, but this one is unique. While auto sales have peaked, and we anticipate a drop-off in 2020—unrelated to the election cycle—we could see further impact on sales if tariffs on foreign-manufactured vehicles or parts are increased. However, because of ongoing negotiations with China and resistance from many sides, it is less likely additional tariffs will be enacted in this election year. While some automakers claim to have made small changes in anticipation of the United States Mexico Canada Agreement (USMCA), that legislation has not been ratified in the U.S., and it might not clear a divided Congress. Even if it does replace the North American Free Trade Agreement, we suspect its effect on domestic manufacturing and future installments of the Cars.com American Made Index will be more evolutionary than revolutionary.
Click here for a complete rundown of 2019 auto sales and what it means for the industry in 2020. Click here to review interesting 2019/2020 data as it applies to select automakers.
Manufacturing ISM
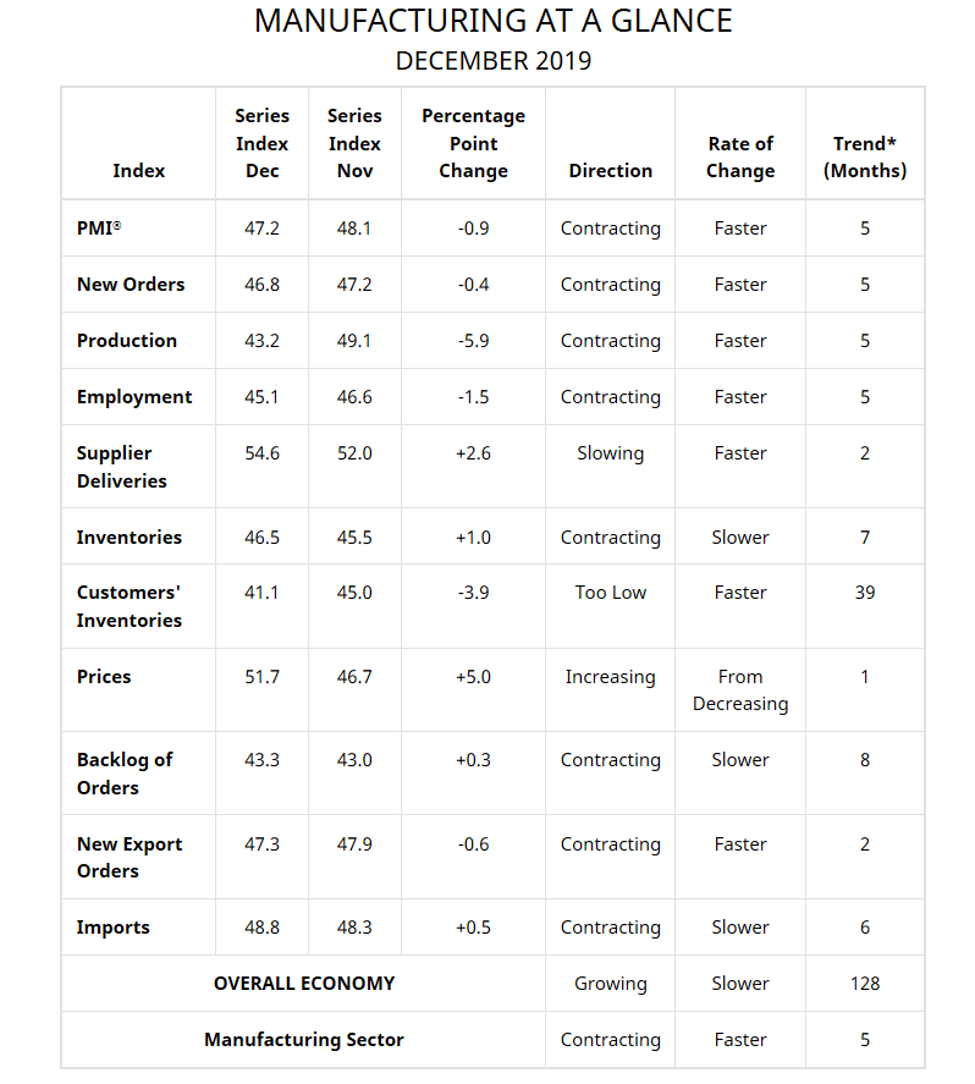
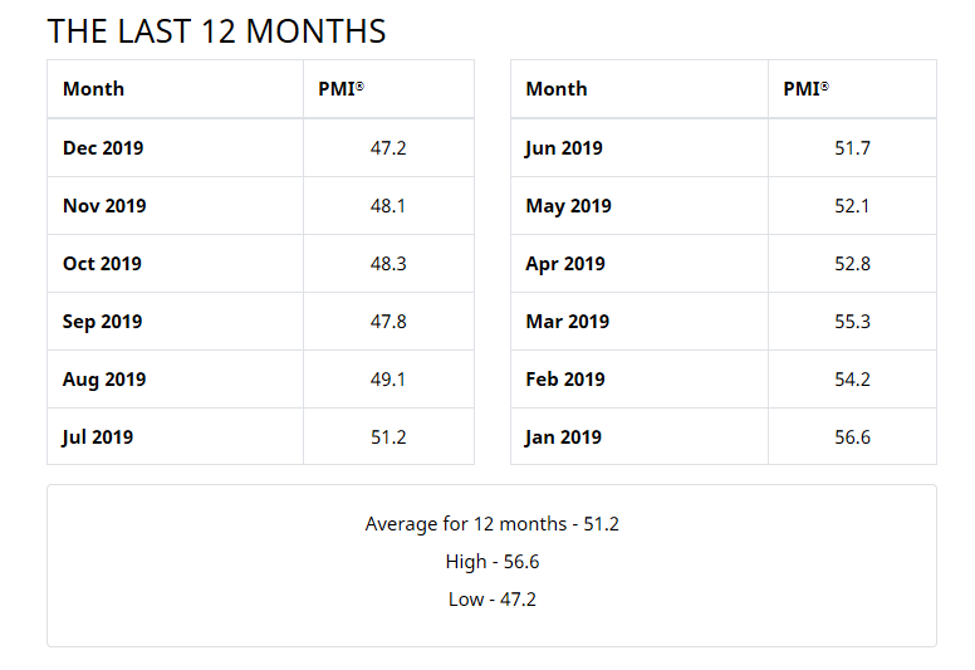
Economic activity in the manufacturing sector contracted in December, and the overall economy grew for the 128th consecutive month, said the nation’s supply executives in the latest Manufacturing ISM® Report On Business®. The December PMI® registered 47.2%, a decrease of 0.9 percentage point from the November reading of 48.1%.
The Report On Business measures its data using the Purchasing Manager’s Index (PMI), which is an indicator of economic health in the manufacturing sector. A reading above 50% indicates that the manufacturing economy is generally expanding, while below 50% indicates that it is generally contracting.
The December 2019 PMI® is the lowest reading since June 2009, when it registered 46.3%. Comments from the panel were consistent with November—sentiment improved in comparison to the third quarter.
December was the fifth consecutive month of PMI® contraction, at a faster rate compared to the prior month. Demand contracted, with the New Orders Index contracting faster, the Customers’ Inventories Index remaining at “too low” status and the Backlog of Orders Index contracting for the eighth straight month (and at similar rates to November). The New Export Orders Index contracted for the second month in a row, recording 10 months of poor performance and likely contributing to the faster contraction of the New Orders Index. Consumption (measured by the Production and Employment indexes) contracted, due primarily to lack of demand, contributing negatively (a combined 7.4-percentage point decrease) to the PMI® calculation. Inputs—expressed as supplier deliveries, inventories and imports—improved in December, due primarily to slowing contraction in inventories and supplier deliveries remaining in expansion territory. Overall, inputs indicate (1) supply chains began to stress in December and (2) companies remained cautious that materials received would be consumed by the end of the fourth quarter. Prices increased for the first time since May 2019, a positive for 2020. – Timothy R. Fiore, CPSM, C.P.M., Chair of the Institute for Supply Management® (ISM®) Manufacturing Business Survey Committee
“Global trade remains the most significant cross-industry issue, but there are signs that several industry sectors will improve as a result of the phase-one trade agreement between the U.S. and China. Among the six big industry sectors, Food, Beverage & Tobacco Products remains the strongest, while Transportation Equipment is the weakest. Overall, sentiment this month is marginally positive regarding near-term growth,” added Fiore.
Of the 18 manufacturing industries, three reported growth in December: Food, Beverage & Tobacco Products, Miscellaneous Manufacturing and Computer & Electronic Products. Fifteen industries reported contraction during December, including Apparel, Leather & Allied Products, Wood Products, Printing & Related Support Activities, Furniture & Related Products, Transportation Equipment, Nonmetallic Mineral Products, Paper Products, Fabricated Metal Products, Petroleum & Coal Products, Electrical Equipment, Appliances & Components, Textile Mills, Primary Metals, Chemical Products, Plastics & Rubber Products, as well as Machinery.
• Commodities Up in Price: Aluminum Products, Copper Products, Scrap Metals, Steel—Hot Rolled (2), Steel—Stainless (3), Steel Products and Valves
• Commodities Down in Price: Caustic Soda (3), Corrugate, High-Density Polyethylene, Freight (3), Natural Gas, Nickel, Polypropylene (2) and Steel (6)
• Commodities in Short Supply: Aluminum Products, Machined Parts and Titanium
Note: The number of consecutive months the commodity is listed is indicated after each item.
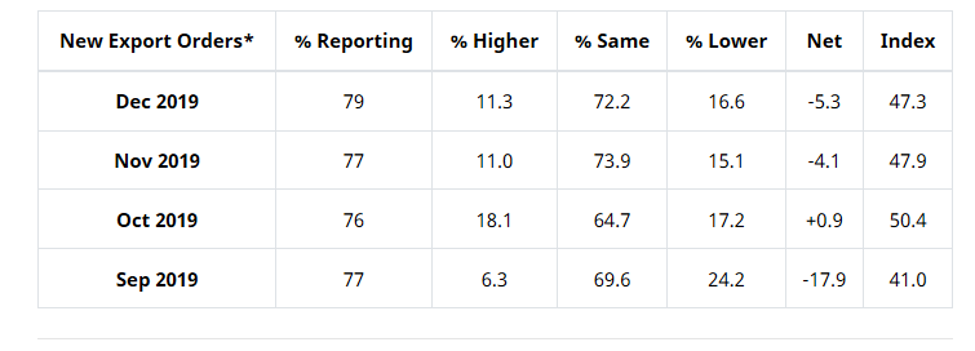
New Export Orders*
The ISM®’s New Export Orders Index registered at 47.3% during December, which is a decrease of 0.6 percentage point compared to the November reading of 47.9%. This indicates that new export orders contracted for the fifth time in six months, with October being the exception. “The index remains in contraction territory, which contributed negatively to the New Orders Index. One of the six big industry sectors expanded, and four contracted during the period. Transportation Equipment remains the weakest among the six big industries,” explained Fiore.
Two industries reported growth in new export orders during December, including Food, Beverage & Tobacco Products and Miscellaneous Manufacturing. Nine industries reported a decrease in new export orders during the same timeframe: Wood Products, Furniture & Related Products, Plastics & Rubber Products, Nonmetallic Mineral Products, Transportation Equipment, Machinery, Fabricated Metal Products, Chemical Products and Computer & Electronic Products. The other six industries reported no change in new export orders in December.
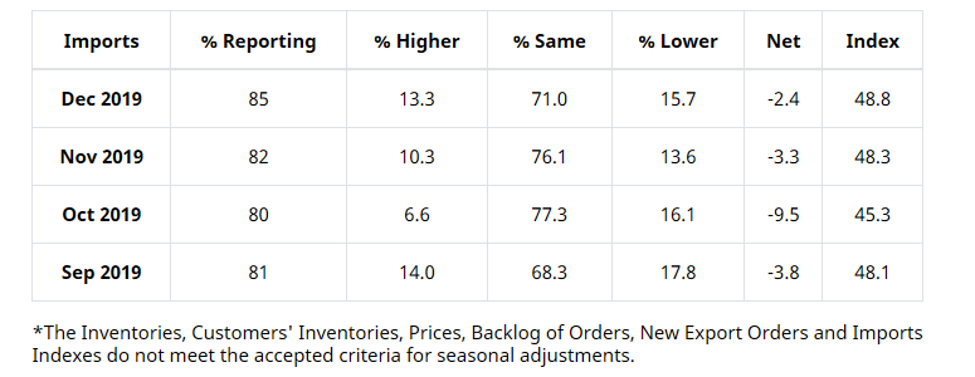
Imports*
The ISM®’s Imports Index registered at 48.8% in December, 0.5 percentage point higher when compared to the 48.3% reported for November, indicating that imports contracted for the sixth consecutive month. “Three of the six big industry sectors contracted, and two expanded. Respondents continued to note the need to receive material in advance of the Lunar New Year season in Asia. This dynamic is offset by the impacts associated with matching inventory and new-order inputs, as well as the overall effects of reshoring activity that began in 2019,” said Fiore.
Six industries reported growth in imports during December, including Wood Products, Printing & Related Support Activities, Computer & Electronic Products, Miscellaneous Manufacturing, Food, Beverage & Tobacco Products and Machinery. Likewise, six industries reported a decrease in imports during the same timeframe: Apparel, Leather & Allied Products, Transportation Equipment, Electrical Equipment, Appliances & Components, Primary Metals, Fabricated Metal Products and Chemical Products. Another six industries reported no change in imports during December.
State of the Economy
While 2019 annual and fourth quarter gross domestic product (GDP) data won’t be released until the end of January, the National Retail Federation (NRF) estimates quarterly growth around 1.8% – 2%. Each year, the holiday season proves critical in year-end numbers. This year, the U.S. posted a 3.4% increase in sales compared to 2018, with digital sales swelling to $723 billion.
In-store transactions were up 1.2%, with e-commerce nabbing approximately 15% of total sales. In fact, U.S. holiday shoppers spent 19% more on their online shopping this year than they did a year ago, according to data from Mastercard SpendingPulse.
A new Salesforce report shows digital sales grew by 8% between Nov. 26 and Dec. 26, generating $723 billion globally. Other notable figures include online sales on Thanksgiving growing 24% to $20 billion, Black Friday up 25% to $40 billion and Cyber Monday rising 13% to $30 billion. Throughout the season, 10% of digital orders were powered by AI and on peak days, more than 10% of mobile traffic and 7% of mobile orders came from a social referring channel. – Adweek
“Households are in good shape. Unemployment is at half-century lows, wages have been increasing faster than inflation and consumer confidence remains near its highs of the cycle. That likely helped shoppers feel particularly jolly this holiday season, and they opened their wallets to celebrate,” said Nicholas Jasinski, author of U.S. Holiday Retail Sales Rose in 2019. Almost All the Growth Was Online.
That’s a big deal for many retailers, many of which cash in 40% or more of their annual sales during the holidays. “The present environment of low unemployment, low inflation, low interest rates, higher wages and job gains along with advances in the stock market has kept consumer attitudes at an elevated level,” commented NRF.
December marked the 22nd consecutive month of the unemployment rate being at or below 4%. U-6, the broadest measure of unemployment and underemployment, in addition to U-4 and U-5 unemployment rates, all hit record lows. Unemployment rates were as follows among the major worker groups: adult men – 3.1%, adult women – 3.2% teenagers – 12.6%, Whites – 3.2%, Blacks – 5.9%, Asians – 2.5% and Hispanics – 4.2%.
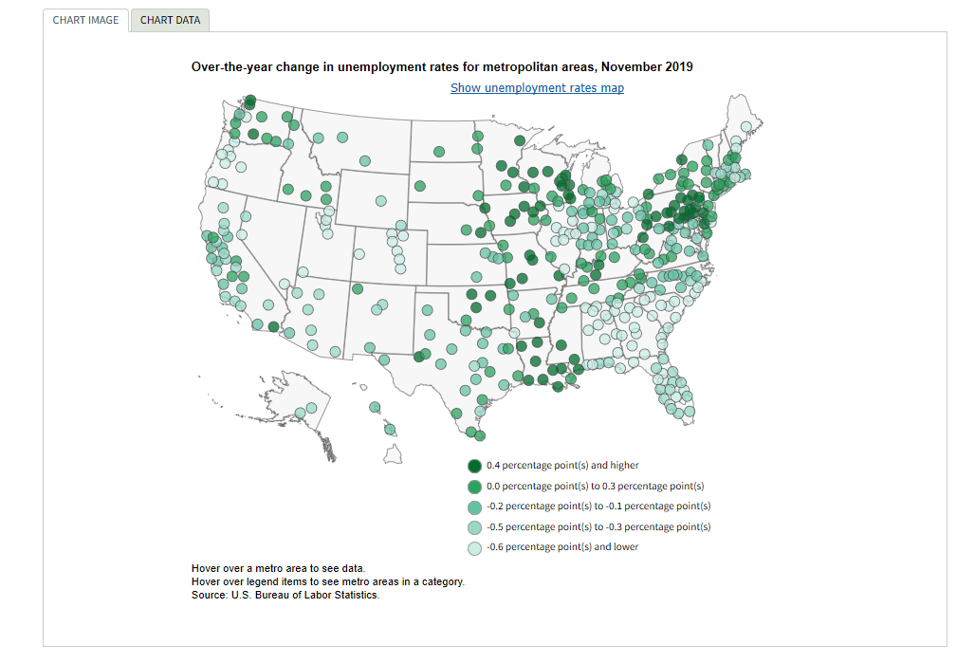
According to the U.S Bureau of Labor Statistics, unemployment rates were lower in 223 of the 389 metropolitan areas, higher in 137 areas and unchanged in 29 areas during November 2019 in comparison to prior year. Kokomo, Indiana reported the largest year-over-year unemployment rate decrease in November (−4.6 percentage points), followed by Rockford, Illinois (−4.3 points) and Panama City, Florida (−4.2 points). Twenty-six other areas had rate declines of at least 1.0 percentage point. The largest year-over-year rate increase occurred in El Centro, California (2.1 percentage points). Logan, Utah-Idaho (1.5%) and Ames, Iowa (1.6%) posted the lowest unemployment rates during November 2019. El Centro, California (20.6%) and Yuma, Arizona (15.4%) had the highest unemployment rates. Furthermore, a total of 215 areas reported November jobless rates below the U.S. rate of 3.3%, 161 areas had rates above it and 13 areas had rates equal to that of the nation.
Employment rose in 36 of the 51 large metropolitan areas, while employment was essentially unchanged in 15 areas during the same timeframe, according to the U.S. Bureau of Labor Statistics. The largest year-over-year percentage increases in employment in these large metropolitan areas occurred in Raleigh, North Carolina – 3.8%, Jacksonville, Florida – 3.4% and Dallas/Fort Worth-Arlington/San Antonio/New Braunfels, Texas – 3.2% each.
Total nonfarm payroll employment rose by 145,000 in December. Important takeaways from recent reporting, courtesy of the U.S. Bureau of Labor Statistics:
• Retail trade added 41,000 jobs. Employment increased in clothing and accessories stores (+33,000) and in building material and garden supply stores (+7,000)—both industries showed employment declines in the prior month. Employment in retail trade changed little, on net, in both 2019 and 2018 (+9,000 and +14,000, respectively).
• Employment in health care increased by 28,000. Ambulatory health care services and hospitals added jobs over the month (+23,000 and +9,000, respectively). Health care added 399,000 jobs in 2019, compared with an increase of 350,000 in 2018.
• Employment in leisure and hospitality continued to trend up in December (+40,000). The industry added 388,000 jobs in 2019, similar to the increase in 2018 (+359,000).
• Mining employment declined by 8,000. In 2019, employment in mining declined by 24,000, after rising by 63,000 in 2018.
• Construction employment changed little this month (+20,000). Employment in the industry rose by 151,000 in 2019, about half of the 2018 gain of 307,000.
• Employment in professional and business services showed little change (+10,000). The industry added 397,000 jobs in 2019, down from an increase of 561,000 jobs in 2018.
• Employment in transportation and warehousing changed little in December (-10,000). Employment in the industry increased by 57,000 in 2019, about one-fourth of the 2018 gain of 216,000.
• Manufacturing employment was little changed (-12,000). Employment in the industry changed little in 2019 (+46,000), after increasing in 2018 (+264,000).
• Employment showed little change in other major industries, including wholesale trade, information, financial activities and government.
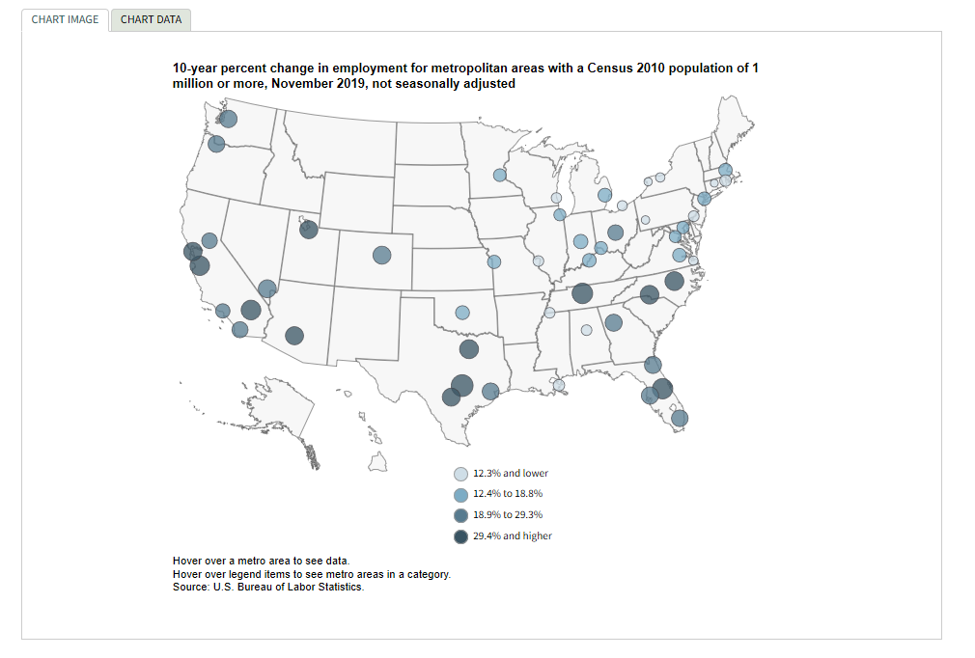
From November 2009 to November 2019, all 51 metropolitan areas with a 2010 Census population of 1 million or more had nonfarm employment gains, ranging from 5.7% in Hartford/West Hartford/East Hartford, Connecticut to 43.1% in Austin/Round Rock, Texas. Larger 10-year employment gains were also seen in Nashville/Davidson/Murfreesboro/Franklin, Tennessee – 38.1%, Orlando/Kissimmee/Sanford, Florida – 37.5% and Riverside/San Bernardino/Ontario, California – 37.5%.
The Voice of Consumers
Though The Conference Board Consumer Confidence Index® reported a marginal decline in consumer confidence following a slight increase in November, the University of Michigan reported that consumer sentiment rose to its highest levels in seven months during December. Low unemployment, healthy job gains, stability in the housing market, booming stocks and an increase in consumer spending this holiday season have the U.S. heading into 2020 on a positive note. Expert feedback includes:
• “Consumer confidence declined marginally in December, following a slight improvement in November,” said Lynn Franco, director of economic indicators at The Conference Board. “While consumers’ assessment of current conditions improved, their expectations declined, driven primarily by a softening in their short-term outlook regarding jobs and financial prospects. While the economy hasn’t shown signs of further weakening, there is little to suggest that growth, and in particular consumer spending, will gain momentum in early 2020.”
• Consumer sentiment rises in December to highest level in seven months, according to a University of Michigan report. “On the eve of 2020, real GDP momentum rests squarely on consumers’ shoulders. While we do not foresee a collapse of this growth pillar next year, we believe the watchword will be ‘cautious enthusiasm’,” said Gregory Daco, chief U.S. economist at Oxford Economics.
• The indexes for gasoline, shelter and medical care all rose in December 2019, accounting for most of the increase in the seasonally adjusted all items index. The gasoline index increased 2.8% during this timeframe. Other major energy component indexes were mixed, and the energy index rose 1.4%. Along with the indexes for shelter and medical care, the indexes for apparel, motor vehicle insurance, recreation and new vehicles all increased in December. The indexes for used cars and trucks, household furnishings and operations, as well as airline fares were among those to decline. The index for all items less food and energy also rose 2.3% over the last 12 months, the same increase as the periods ending October and November. This was larger than the 2018 increase of 1.9% and the largest advance since the 3% uptick in 2011. The food index rose 1.8% over the last 12 months, while the energy index increased 3.4%.
New and Used Vehicle Sales
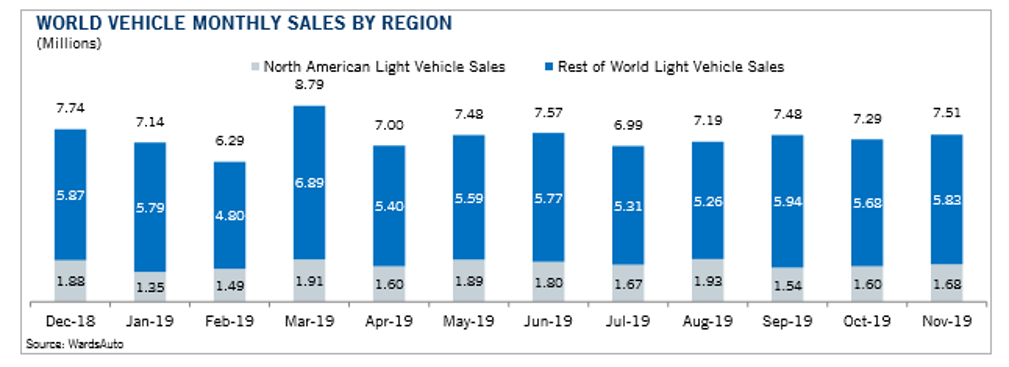
While Automotive News puts 2019 U.S. light vehicle sales a smidge above 17 million, Manheim data suggests otherwise—clocking 16.97 million, which breaks the five-year streak of record-breaking sales. Additionally, the December 2019 SAAR came in at 16.7 million, a decline from last year’s 17.4 million and down from November’s 17.1 million rate. New vehicle inventories came in under 4 million units for the eighth consecutive month.
“Fleet was a core driver of strength in the new vehicle market for 2019, but fleet purchases slowed by year-end. Combined rental, commercial and government purchases of new vehicles were down 0.7% year-over-year in December. Retail sales of new vehicles were down 7.1% in December, leading to a retail SAAR of 14.3 million, down from 15.0 million last December and down from November’s 14.8 million rate. Fleet sales were up 2.9% in 2019, and retail sales were down 2.3%, as the overall new vehicle market finished the year down 1.4%,” explained Manheim.
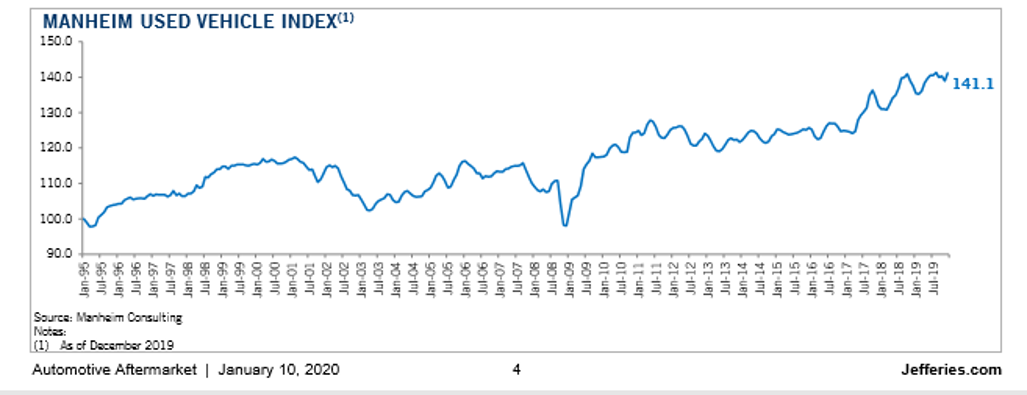
Wholesale used vehicle prices (on a mix-, mileage- and seasonally adjusted basis) increased 1.54% month-over-month in December. This brought the Manheim Used Vehicle Value Index to 141.1, a 2.5% increase from a year ago. “Following a normalizing trend in weekly Manheim Market Report (MMR) prices at the end of November, December saw stability and even gains in many segments. Three-year-old vehicle values in aggregate were up 0.1% for the month. As a result of the stabilization at year-end, prices in aggregate ended 2019 at a historically more normal level of 90% relative to the value at the beginning of the year but well below the performance experienced in either of the last two years,” added Manheim.
According to Cox Automotive estimates, total used vehicle sales volume was flat year-over-year in December. Conversely, “Manheim estimates the December used SAAR to be 40.0 million, on par with 40.0 million last December and up from November’s 39.7 million rate. The December used retail SAAR estimate is 20.1 million, up from 19.6 million last year and up month-over-month from November’s 19.3 million rate.”
Automotive Aftermarket
In December 2019, SEMA published What’s Trending for 2020, highlighting valuable input from the organization’s council and network leaders.
Automotive Restoration Market Organization (ARMO) Chair: Tray Smith, H&H Classic Parts
• In the hot-rod and restoration market, the square-body truck is the hot thing, so we’re all scrambling to get as much product out there for square bodies as possible. You’ve always got to be looking through a set of binoculars to determine what’s coming down the road.
• For restoration, restomod customization is ruling the roost. Core restoration will always be there, but the restomod and custom car is at the forefront, and we see that reflected in product that we’re selling: more upgrades, more accessories, more conversion products.
Emerging Trends & Technology Network (ETTN) Chair: Ian Lehn, BOOSTane
• Vehicle electrification and autonomy will continue to be more prevalent in our industry. However, they shouldn’t be looked at as hurdles, but instead opportunities. These new technologies and trends toward autonomy are opportunities for our industry to look at new business. There are many opportunities to capitalize on vehicle autonomy, electrification and internal combustion engine advancements.
• The other trend we will see is that the landscape of vehicle ownership will continue to evolve. ETTN recognizes that much of the industry views these types of progressions as a hindrance, but there are still plenty of youngsters who are into racing and vehicle modification. My daily driver wasn’t the vehicle that I was doing all of my modifications to—it was the car I was rebuilding in my dad’s garage. Those kids still exist—cars are still cool.
• The challenges we face today are the same ones the industry has always faced—the stigma that the industry is going to disappear because of new technology. ETTN as a network is always going to try to dispel that line of thinking. Technology shouldn’t be looked at as a roadblock, but instead a pitstop.
Hot Rod Industry Alliance (HRIA) Chair: Jeffrey Major, Bedwood and Parts LLC
• As we are seeing with the rest of the aftermarket, pickup accessories also continue to drive growth in the hot-rod segment. For HRIA-member companies, the state sales tax nexus issue has moved front and center and has the potential to be the greatest challenge we have ever faced. Although there are various sources of information, SEMA’s Washington, D.C., office is compiling a state-by-state guideline to assist our member companies. Our members are also challenged with enforcing minimum advertised pricing (MAP) policies with their dealer network. As this can be a sensitive issue, we are researching the methods and enforcement ideas that have proven successful to share with our membership.
Motorsports Parts Manufacturers Council (MPMC) Chair: Rob Fisher, E3 Spark Plugs
• Many of our member companies are having a good year from a sales standpoint. There seems to be good competitor growth within certain motorsports segments. Just look at the factory stock supercar ranks in both NHRA and NMCA; they have had some solid fields this year. Outlaw drag racing is a perennial favorite. Fan interest is growing as well. I feel positive about the outlook for racing and manufacturers that make parts for race cars. If the economy keeps pace, we should have a good 2020.
• Across the board, technology is trending. Embracing digital technologies to help drive sales and connect with customers, automating manufacturing processes, updating facilities technology or simply trying to bring new technologies from other industries to motorsports are all areas where advancing technologies will make an impact.
Professional Restylers Organization (PRO) Chair: Dino Perfetti, Automotive Concepts/Champion Heated Seats
• The restyling industry has as many challenges as opportunities. When marketing, selling and installing aftermarket products through new-car dealer franchises, OEMs view restylers as competitors when they’re not. One of PRO’s new initiatives at this year’s SEMA Show will be the SEMA PRO Cup Challenge. This is an opportunity for restylers to build and display a vehicle on a dealership’s floor that appeals to many potential buyers while being both affordable and profitable to both the restyler and dealer franchise. The rules for this inaugural year are simple: do not exceed $12,500 MSRP for the package and build the vehicle within 20 labor hours.
SEMA Businesswomen’s Network (SBN) Chair: Lana Chrisman, McLeod Racing
• I see our industry as anxious to keep up with the demand for automotive technology that matches the consumer’s way of life. Cars have always represented an extension of our lifestyle and personality. For our industry to remain relevant and for cars to hold their place, it’s going to take entrepreneurs with vision to accommodate the demands of today’s consumers. Automotive performance must go beyond torque and horsepower.
• The major initiatives SBN is focusing on this year include career development, industry best practices, mentoring programs and women-owned business programs.
Truck & Off-Road Alliance (TORA) Chair: Erika Marquez, Warn Industries Inc.
• According to the “2019 SEMA Industry Perspectives” report, 73% of businesses expect their company’s sales to grow over the next year. It’s great to hear that consumer sentiment toward the United States’ economy is positive. In our market segment, we see more of the traditional light-truck accessories retailers diversifying into off-road markets. The pickup segment accounts for the biggest slice of consumer dollars spent on specialty parts with a 29% share, according to the report.
• A vehicle technology and education subcommittee has also been created to offer the latest vehicle trends and new safety performance technology.
• In terms of vehicle sales, the light-truck market continues to grow. However, the consumer demographic is switching as more millennials are purchasing vehicles. Although pickups and SUVs are still experiencing strong sales, CUVs are projected to drive the majority of growth in the light-truck market over the next five years, according to the “SEMA Future Trends Report,” with 69% market share by 2025. Younger generations are looking for style and off-road capabilities without sacrificing performance and fuel efficiency. There is a need for more aftermarket products and accessories to upfit the huge number of CUVs projected to be on the road.
• The trade war between the United States and China poses a challenge for our industry. American-made manufacturers that source products impacted by increased tariffs are having to pass some of those increases on to the consumer, and in the long run, this is going to affect the economy and slow consumer spending. Corporate strategies to mitigate this situation cause disruptions in supply chains, and that makes planning difficult.
• Customizing and modifying vehicles with factory-installed ADAS technology is something we need to address since these systems are becoming standard equipment on every new light truck produced. SEMA is already working on understanding this technology and helping member companies understand how their businesses will be impacted by it.
Wheel & Tire Council (WTC)Chair: Tyson Boyer, Dill Air Controls Products LLC
• The wheel and tire marketplace continues to face challenges. Some of these challenges can be attributed to the slowed growth in new-car sales, major mergers and acquisitions over the last few years, variable raw materials costs and global economic and trade uncertainties, most notably the continued increases in tariffs.
• These are causing manufacturers in our space to redefine company goals and, in some cases, put a hold on their aggressive expansion plans. This means you cannot sit still because the change-opportunity time is ripe:
– On the internal side, collectively brainstorm for new sales techniques, transform your B2C product offerings, engage in alternative training, dissect your technology in-house and on the e-commerce side, as well as your team’s aptitude in order to constantly deliver beyond the customer’s expectations.
– Externally, creatively review your current business model and update your customer value propositions to adapt to the rapidly changing digital space. Analyze your partnerships and sourcing strategies. Trust your gut and do not hold back on taking the calculated risk move.
Young Executives Network (YEN) Chair: Kirstin Stone, Derive Systems
• The most recent generational shift has really changed the landscape for hiring and retaining employees in the industry. Millennials, who make up the vast majority of the YEN membership at this point, also make up about 50% of the workforce.
• One of the greatest driving forces for our generation when it comes to choosing an employer is finding purpose in our work, and that’s great news for the aftermarket. Most people in this industry were enthusiasts before their time in the workforce started, so the purpose is built in.
February Trade and Auto Shows
• Cincinnati Auto Expo: February 5 – 9
• Buffalo Auto Show: February 6 – 9
• Syracuse Auto Expo: February 6 – 9
• Motortrend International Auto Show: February 6 – 9
• Chicago Auto Show: February 8 – 17
• Philadelphia Auto Show: February 8 – 17
• Pittsburgh International Auto Show: February 14 – 17
• Canadian International Auto Show: February 14 – 23
• Midwest Overlanding Off-Road Expo: February 15 – 16
• Cleveland Auto Show: February 21 – March 1


