KPI — September: State of the Economy
Economic growth is on the rise in the third quarter, following a sharp contraction of 31.7% (annualized rate) during the second quarter. Reviving the U.S. economy to “soaring” pre-pandemic levels undoubtedly will take time, but “there has been some progress in driving economic activity higher over the summer, despite a sharp uptick in new COVID-19 cases,” according to The Conference Board. In fact, “Various economic indicators that we track have rebounded in July and August at a greater than expected rate.”
“This year, the United States has seen the smallest economic contraction of any major Western nation, and we are recovering at a much faster rate than any other nation,” said President Trump at a recent press briefing.
Many economists predicted a strong third-quarter rebound. Rather, concerns relate to the sustainability of recovery efforts beyond that timeframe. “The pandemic-induced lockdown in March and April yielded a supply-side shock that is now transforming into a demand shock. High unemployment rates, low consumer confidence and income disruptions are likely to limit consumer spending later in the year,” explained The Conference Board, which outlined two likely economic recovery models:
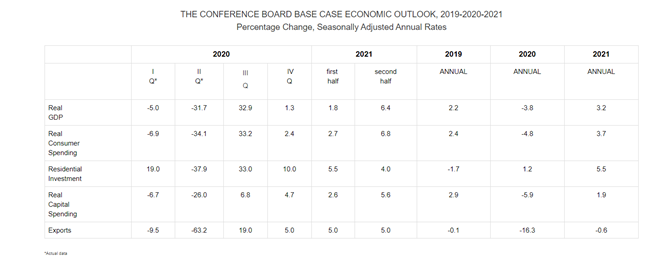
• Base Case Forecast: This forecast includes a third-quarter GDP rebound of 32.9%. “Given the severity of the economic contraction in the second quarter, even a moderate improvement in economic activity over the summer yields a strong growth rate in the third quarter. While consumer spending has been the largest driver of growth over the summer, we expect it to stall as high levels of unemployment damage spending later in the year, leading to a much slower GDP expansion of only 1.3% in the fourth quarter. This results in an annual growth rate of -3.8% in 2020 and puts the U.S. economy on a modest recovery path of about 3.2% growth in 2021.”
• Upside Forecast: This forecast presents a more optimistic scenario in which the growth momentum between May and August is sustained for the remainder of the year, though at a slower pace. “In this scenario, we adopt a more optimistic outlook on the impact of unemployment on U.S. consumption in the fourth quarter—resulting in a ‘swoosh-shaped recovery’ for the U.S. economy. This upside forecast results in an annual growth rate of -3.2% in 2020 and a strong rebound of 6.9% in 2021. In this scenario, U.S. monthly economic output recovers completely to pre-pandemic levels by January 2021.”
Employment
Total nonfarm payroll employment increased by 1.4 million in August, dropping the unemployment rate to 8.4%. “These improvements in the labor market reflect the continued resumption of economic activity that had been curtailed due to the coronavirus (COVID-19) pandemic and efforts to contain it,” explained the U.S. Bureau of Labor Statistics.
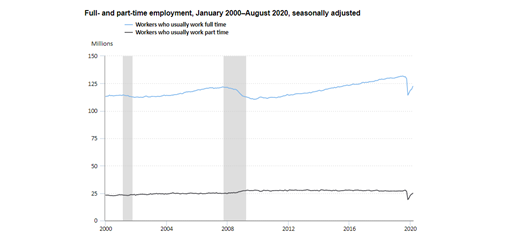
The number of people who usually work full time rose by 2.8 million in August and the number who usually work part-time increased by 991,000, according to the U.S. Bureau of Labor Statistics. After large declines in March and April, employment has risen in each month since April, with the number of full-time workers increasing by 8 million and the number of part-time workers rising by 5.9 million. The number of people who usually work part-time increased by 11.8% from May to June; this was the largest month-over-month increase since data were first collected in 1968.
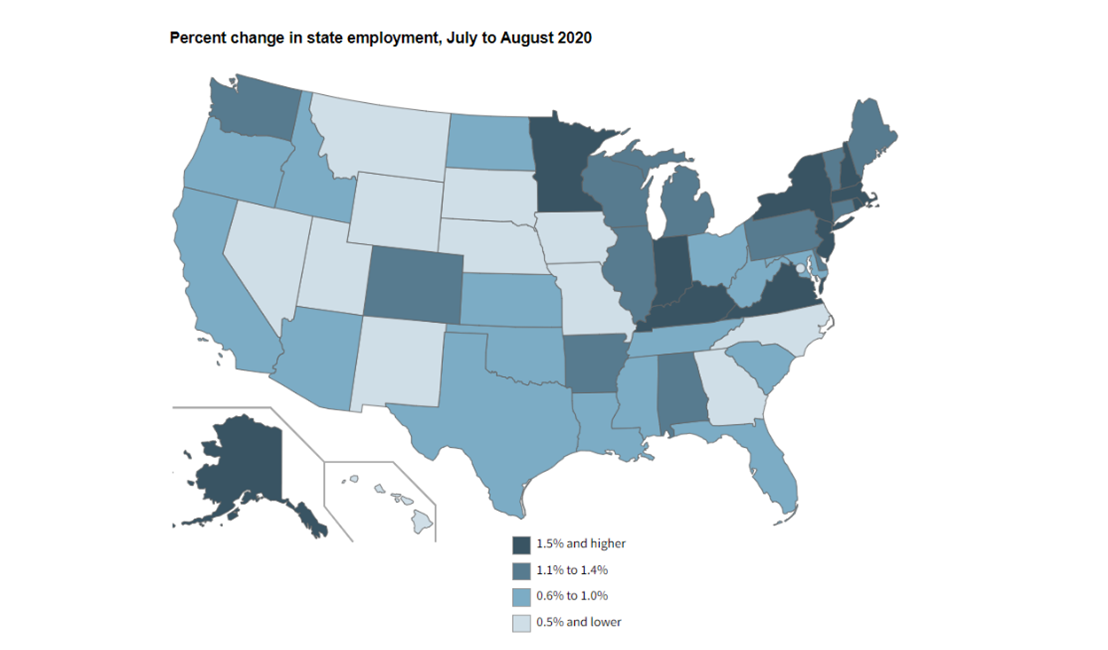
The largest job gains occurred in New York (+153,300), Texas (+106,800) and California (+101,900). The largest percentage increases occurred in New Jersey, New York and Virginia (+1.8% each), followed by Kentucky and New Hampshire (+1.7% each), then Alaska, Indiana and Massachusetts (+1.6% each).
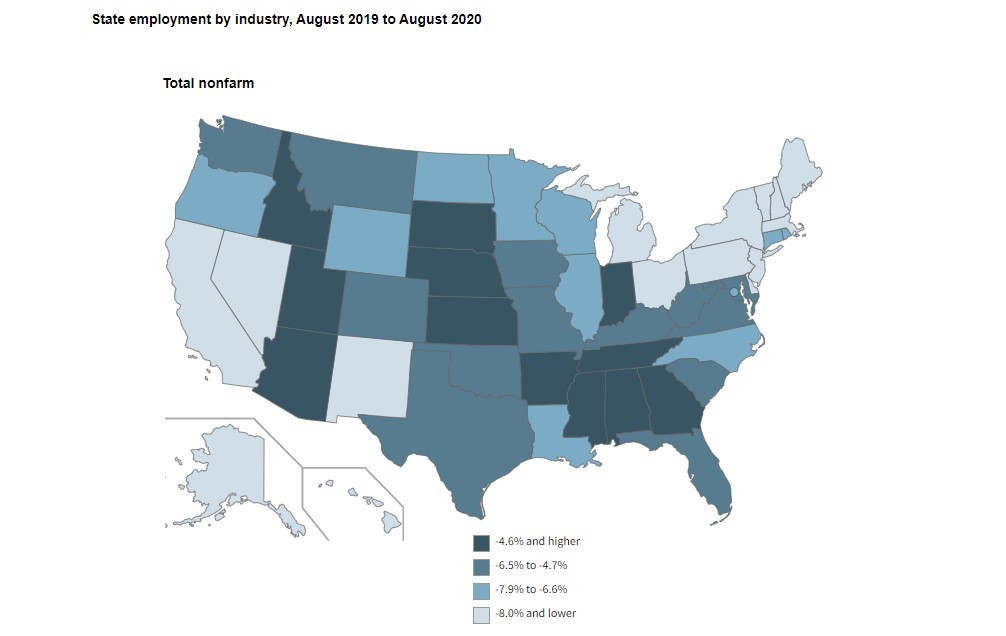
During 2020, nonfarm payroll employment decreased in 49 states and the District of Columbia, and was labeled as “essentially unchanged” in one state. The largest percentage declines occurred in Hawaii (−16.1%), New York (−12.4%) and Massachusetts (−10.9%). The smallest percentage declines occurred in Utah (−1.8%), Mississippi (−2.6%) and Arizona (−3.2%).
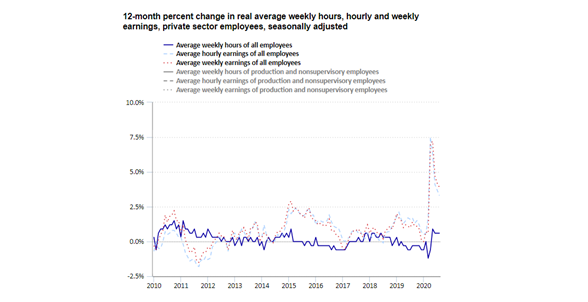
Furthermore, real average hourly earnings increased 3.3% year-over-year in August 2020, according to the U.S. Bureau of Labor Statistics. The change in real average hourly earnings, in combination with an increase of 0.6% in the average workweek, resulted in a 3.9% increase in real average weekly earnings over the reporting period.
“The increases in real average hourly and weekly earnings largely reflect the substantial job loss over the year among lower-paid workers as a result of the COVID-19 pandemic and efforts to contain it,” according to the U.S. Bureau of Labor Statistics.
By Demographic
Unemployment rates declined in August among major worker groups: adult men—8%, adult women—8.4%, teenagers—16.1%, Whites—7.3%, Hispanics—10.5%, Asians—10.7% and Blacks—13%.
By Industry
Total nonfarm payroll employment posted an increase of 1.4 million in August, following increases of larger magnitude in the prior three months, according to the U.S. Bureau of Labor Statistics. During this timeframe, nonfarm employment was below its February level by 11.5 million, or 7.6%.
Notable job gains occurred in retail trade, professional and business services, leisure and hospitality, as well as education and health services.
Important takeaways, courtesy of the U.S. Bureau of Labor Statistics
- Government employment increased by 344,000, accounting for one-fourth of the month-over-month gain in total nonfarm employment. Job gains in federal government (+251,000) reflect the hiring of 238,000 temporary 2020 Census workers. Local government employment rose by 95,000. Overall, government employment is 831,000 below its February level.
- Retail trade added 249,000 jobs, with almost half the growth occurring in general merchandise stores (+116,000). Gains also occurred in motor vehicle and parts dealers (+22,000), electronics and appliance stores (+21,000) and miscellaneous store retailers (+17,000). Employment in retail trade is 655,000 lower than in February.
- Professional and business services increased by 197,000. More than half of the gain occurred in temporary help services (+107,000). Professional and business services is 1.5 million below its February level.
- Architectural and engineering services (+14,000), business support services (+13,000), as well as computer systems design and related services (+13,000) also posted job gains.
- Leisure and hospitality increased by 174,000, with about three-fourths of the gain occurring in food services and drinking places (+134,000). Despite job gains totaling 3.6 million over the last four months, employment in food services and drinking places is down by 2.5 million since February.
- Education and health services increased by 147,000 but remain 1.5 million below February’s level.
- Health care employment increased by 75,000, with gains in offices of physicians (+27,000), offices of dentists (+22,000), hospitals (+14,000) and home health care services (+12,000). Job losses continued in nursing and residential care facilities (-14,000). Employment in private education rose by 57,000 month-over-month.
- Transportation and warehousing rose by 78,000, with gains in warehousing and storage (+34,000), transit and ground passenger transportation (+11,000) and truck transportation (+10,000). Employment in transportation and warehousing is down by 381,000 since February.
- “Other services” industry added 74,000 jobs, reflecting gains in membership associations and organizations (+31,000), repair and maintenance (+29,000), as well as personal and laundry services (+14,000). Employment in other services is 531,000 lower than in February.
- Financial activities added 36,000 jobs, with most of the growth in real estate and rental and leasing (+23,000). Employment in financial activities is down by 191,000 since February.
- Manufacturing employment rose by 29,000, with gains concentrated in the nondurable goods component (+27,000). Despite gains in recent months, employment in manufacturing is 720,000 below February’s level.
- Wholesale trade increased by 14,000, reflecting an increase of 9,000 in the nondurable goods component. Wholesale trade employment has declined by 328,000 since February.
- Employment changed little in mining, construction and information.
By Geography
Unemployment rates were lower in August in 41 states, higher in two and stable in seven, including the District of Columbia, according to the U.S. Bureau of Labor Statistics.
Nevada reported the highest unemployment rate in August at 13.2%, followed by Rhode Island (12.8%), as well as Hawaii and New York (12.5% each). Nebraska had the lowest rate at 4%, followed by Utah (4.1%) and Idaho (4.2%). In total, 29 states posted jobless rates lower than 8.4%, 10 had higher rates and 11—including the District of Columbia—had rates that were not appreciably different from that of the nation.
The largest unemployment rate decreases occurred in Massachusetts (-4.9 percentage points) and Arizona (-4.8 points). Rates declined over the month by at least two percentage points in an additional 14 states. The only month-over-month jobless rate increases occurred in Kentucky (+3.1 percentage points) and Rhode Island (+1.5 points).
Meanwhile, the largest year-over-year unemployment rate increases occurred in Hawaii (+9.8 percentage points), Nevada (+9.4 points) and Rhode Island (+9.3 points). Likewise, the smallest rate increases occurred in Nebraska (+0.9 percentage point) and Alaska (+1.2 points).
KPI — September: State of the Manufacturing Sector
Key Performance Indicators Report — September 2020


