KPI — September: State of the Manufacturing Sector

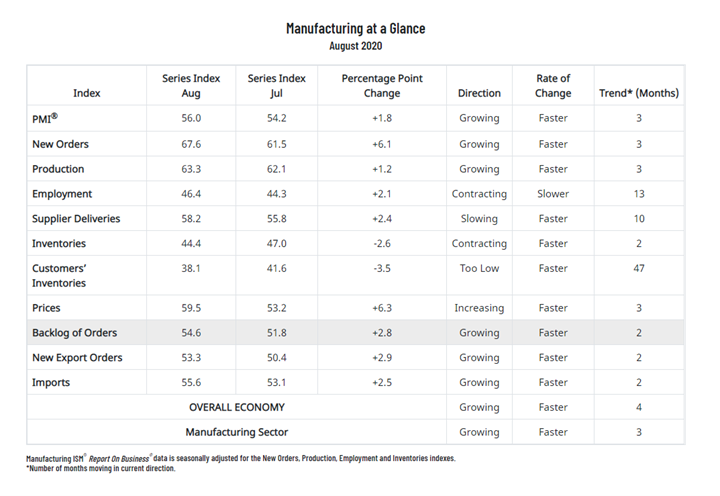
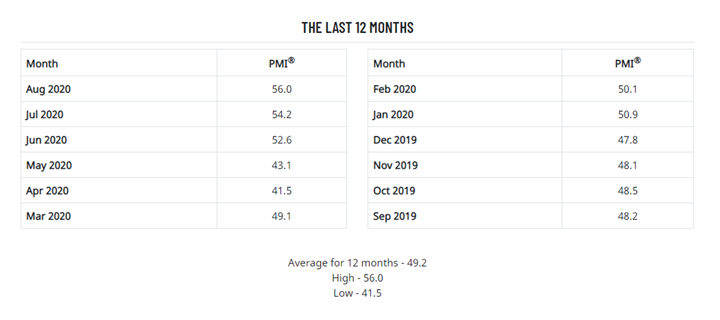
Economic activity in the manufacturing sector grew during August, with the overall economy securing a fourth consecutive month of growth, according to the nation’s supply executives in the latest Manufacturing ISM® Report On Business®. The August PMI® registered 56%, up 1.8 percentage points from the July reading of 54.2%.
The Report On Business® measures its data using the Purchasing Manager’s Index (PMI), which is an indicator of economic health in the manufacturing sector. A reading above 50% indicates that the manufacturing economy is generally expanding, while below 50% indicates that it is generally contracting. All data and analysis are courtesy of Institute for Supply Management.
“After the coronavirus (COVID-19) brought manufacturing activity to historic lows, the sector continued its recovery in August, the first full month of operations after supply chains restarted and adjustments were made for employees to return to work,” said Timothy R. Fiore, CPSM, C.P.M., Chair of the Institute for Supply Management® (ISM®) Manufacturing Business Survey Committee.
“Demand and consumption continued to drive expansion growth, with inputs representing near- and moderate-term supply chain difficulties,” he continued. “Impacted by the current economic environment, many panelists’ companies are holding off on capital investments for the rest of 2020. In addition, (1) commercial aerospace equipment companies, (2) office furniture and commercial office building sub-suppliers and (3) companies operating in the oil and gas markets—as well as their supporting supply bases—are and will continue to be impacted due to low demand. These companies represent approximately 20% of manufacturing output. This situation will likely continue at least through the end of the year,” explained Fiore.
- Demand expanded, with the (1) New Orders Index growing at very strong levels, supported by the New Export Orders Index expanding modestly; (2) Customers’ Inventories Index at its lowest figure since June 2010, a level considered a positive for future production and (3) Backlog of Orders Index indicating growth for the second consecutive month.
- Consumption (measured by the Production and Employment indexes) contributed positively (a combined 3.3-percentage point increase) to the PMI® calculation, with industries continuing to expand output compared to July.
- Inputs—expressed as supplier deliveries, inventories and imports—were flat during the survey period, due to supplier delivery issues returning and import levels expanding moderately. Inventory levels contracted again due to strong production output and supplier delivery difficulties. Inputs likely were the biggest impediment to production growth and contributed negatively (a combined 0.2-percentage point decrease) to the PMI® calculation.
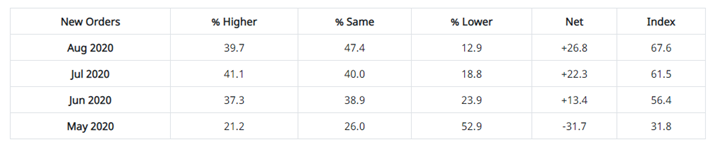
ISM®’s New Orders Index registered at 67.6% in August, an increase of 6.1 percentage points compared to the 61.5% reported in July. This indicates that new orders grew for the third consecutive month. “All of the top six industry sectors (Computer & Electronic Products; Chemical Products; Food, Beverage & Tobacco Products; Petroleum & Coal Products; Fabricated Metal Products; and Transportation Equipment) expanded. Demand improved in August, as demonstrated by 15 industry sectors expanding and only one contracting. The index achieved its highest level of performance since January 2004 (70.6%),” said Fiore. A New Orders Index above 52.5%, over time, is generally consistent with an increase in the Census Bureau’s series on manufacturing orders (in constant 2000 dollars).
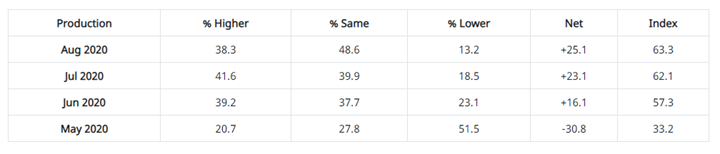
The Production Index came in at 63.3% in August, up 1.2 percentage points from 62.1% in July, indicating growth for the third consecutive month. “All of the top six industries expanded strongly, an improvement from July. The index achieved its highest level of performance since January 2018, when it registered 64.2%,” said Fiore. An index above 51.7%, over time, is generally consistent with an increase in the Federal Reserve Board’s Industrial Production figures.
Fifteen of 18 manufacturing industries reported growth in August: Wood Products; Plastics & Rubber Products; Food, Beverage & Tobacco Products; Textile Mills; Chemical Products; Computer & Electronic Products; Primary Metals; Fabricated Metal Products; Machinery; Apparel, Leather & Allied Products; Nonmetallic Mineral Products; Miscellaneous Manufacturing; Electrical Equipment, Appliances & Components; Paper Products; and Transportation Equipment. The three industries reporting contraction in August include Printing & Related Support Activities; Petroleum & Coal Products; and Furniture & Related Products.
- Commodities Up in Price: Aluminum (3); Copper (3); Crude Oil (4); Freight; High-Density Polyethylene (2); Lumber (2); Natural Gas; Packaging Materials; Polyethylene; Polypropylene (2); Precious Metals (2); Propylene; Steel*; Steel—Scrap; and Steel—Stainless.
- Commodities Down in Price: Steel*; and Steel—Hot Rolled (2).
- Commodities in Short Supply: Aluminum Cans; Electronic Components; Freight; Lumber; and Personal Protective Equipment (PPE)—Gloves (6).
Note: The number of consecutive months the commodity is listed is indicated after each item. *Indicates both up and down in price.
What Respondents Are Saying
- “Watching COVID-19 situations in Mexico, Brazil, Philippines [and] Hong Kong. High rates of COVID-19 surging. Currently, lines of supply no longer impacted by COVID-19 related events.” (Computer & Electronic Products)
- “Business is very good. Production cannot keep up with demand. Some upstream supply chains are starting to have issues with raw material and/or transportation availability.” (Chemical Products)
- “Airline industry continues to be under great pressure.” (Transportation Equipment)
- “Current sales to domestic markets are substantially stronger than forecasted. We expected a recession, but it did not turn out that way. Retail and trade customer markets are very strong and driving shortages in raw material suppliers, increasing supplier orders.” (Fabricated Metal Products)
- “Homebuilder business continues to be robust, with month-over-month gains continuing since May. Business remains favorable and will only be held back by supply issues across the entire industry.” (Wood Products)
- “We are seeing solid month-over-month order improvement in all manufacturing sectors such as electrical, auto and industrial goods. Looking to add a few factory operators.” (Plastics & Rubber Products)
- “Rolling production forecasts are increasing each week compared to prior forecast.” (Primary Metals)
- “[Production ramp-up] has been a struggle. We have started and stopped lines numerous times at all 18 of our manufacturing plants due to COVID-19 issues. Surprisingly, our direct suppliers have done an excellent job on shipping ingredients and packaging on time.” (Food, Beverage & Tobacco Products)
- “Strong demand from existing and new customers for our products, stable-to-decreasing input costs for our operations and record numbers of new business opportunities from prospective customers’ reshoring measures. All trends continuing from the first quarter of fiscal year 2017.” (Electrical Equipment, Appliances & Components)
- “Capital equipment new orders have slowed again. Quoting is active. Many customers waiting for the fourth quarter to make any commitments.” (Machinery)
- “We are starting to see parts of our business rebound in August, while other parts remained weak. Some of our export business has come back for the first time since the start of COVID-19; however, domestic portfolios remain mixed.” (Paper Products)
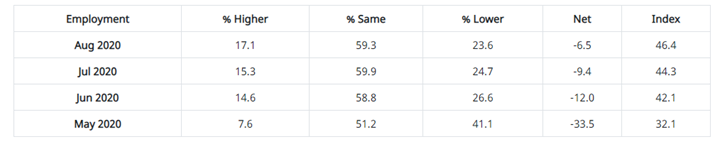
ISM®’s Employment Index registered 46.4% in August—2.1 percentage points higher than the July reading of 44.3%. “This is the 13th consecutive month of employment contraction, at a slower rate compared to July. This marks the fourth consecutive month of improvement since the index’s low of 27.5% registered in April. Three of the six big industry sectors experienced expansion, as factories were able to maintain significant gains in output with a reduced labor pool. Long-term labor market growth remains uncertain, but strong new-order levels and an expanding backlog signify potential strength for the rest of the third quarter. Survey comments indicate that more panelists’ companies are hiring or attempting to hire compared to actively and passively reducing their labor forces,” explained Fiore. An Employment Index above 50.8%, over time, is generally consistent with an increase in the Bureau of Labor Statistics (BLS) data on manufacturing employment.
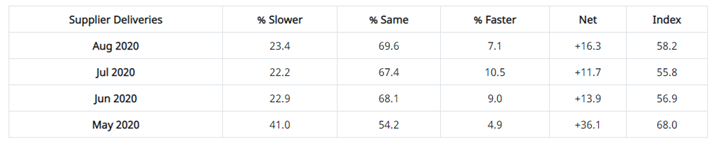
The delivery performance of suppliers to manufacturing organizations was slower in August, as the Supplier Deliveries Index registered 58.2%. This is 2.4 percentage points higher than the 55.8% reported in July. “Suppliers continue to struggle to deliver, slowing deliveries at a faster rate compared to July. Plant interruptions, transportation challenges and continuing difficulties in supplier labor markets are still significant factors. The Supplier Deliveries Index reflects the difficulties suppliers will continue to experience due to COVID-19 impacts. These issues are not expected to diminish in the near future and, at this time, represent the biggest hurdle to production output and inventory growth,” said Fiore. A reading below 50% indicates faster deliveries, while a reading above 50% indicates slower deliveries.
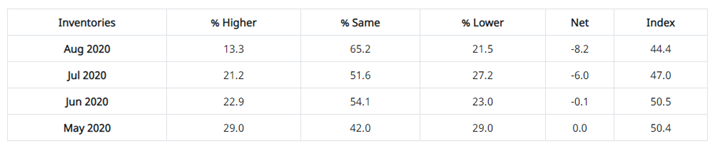
The Inventories Index registered 44.4% in August—2.6 percentage points lower than the 47% reported for July. Inventories contracted for the second straight month after two consecutive months of expansion. This is the lowest reading for the Inventories Index since January 2014 (43.9%). “Inventory levels were impacted by increases in production output and restrained by continuing supplier difficulties as noted above,” said Fiore. An Inventories Index greater than 44.3%, over time, is generally consistent with expansion in the Bureau of Economic Analysis (BEA) figures on overall manufacturing inventories (in chained 2000 dollars).
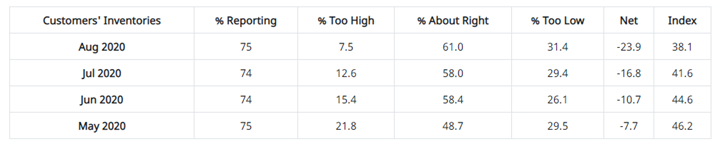
ISM®’s Customers’ Inventories Index registered 38.1% in August, 3.5 percentage points lower than the 41.6% reported for July, indicating that customers’ inventory levels were considered too low. “Customers’ inventories are too low for the 47th consecutive month and moved further into ‘too low’ territory in August, a positive for future production growth. It’s been more than a decade (a reading of 35.8% in June 2010) since the Customers’ Inventories index has been at this level,” explained Fiore.
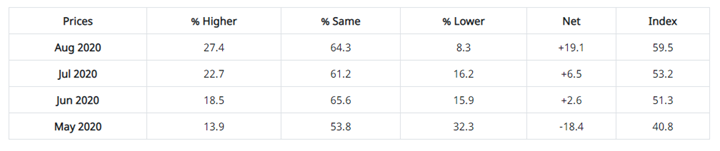
The ISM® Prices Index registered 59.5%, a jump of 6.3 percentage points compared to the July reading of 53.2%. This indicates raw material prices increased for the third consecutive month. “Price increases were driven primarily by plastics, lumber, aluminum, copper, some steel products, transportation expenses, precious metals and petroleum products. Price growth reflects a power shift toward sellers, as increased costs to produce input materials are being passed on to panelists’ companies,” said Fiore. A Prices Index above 52.5%, over time, is generally consistent with an increase in the Bureau of Labor Statistics (BLS) Producer Price Index for Intermediate Materials.
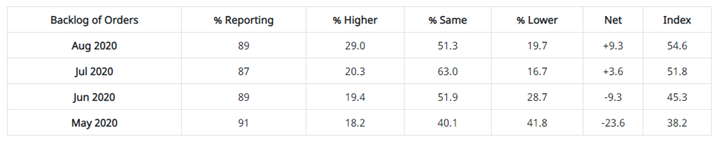
ISM®’s Backlog of Orders Index registered 54.6% in August, a 2.8-percentage point increase compared to the 51.8% reported in July, indicating order backlogs expanded for the second consecutive month after four straight months of contraction. “Backlogs expanded at faster rates in August, indicating that new-order intakes were sufficient to fully offset production outputs. Four of the six big industry sectors’ backlogs expanded, an improvement from July. The index achieved its highest level of expansion since November 2018 (56.4%),” added Fiore.
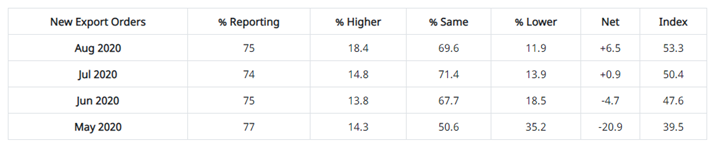
ISM®’s New Export Orders Index registered 53.3% in August, up 2.9 percentage points compared to the July reading of 50.4%. “The New Export Orders Index grew for the second consecutive month at a faster rate and reached its highest level since January (53.3%). With four of the six big industry sectors expanding, new export orders were a positive factor to the growth in new orders,” said Fiore.
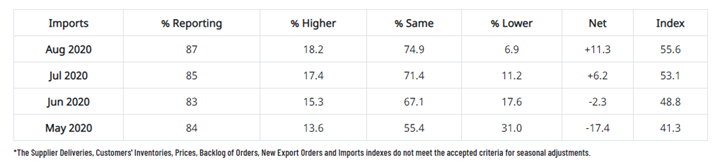
ISM®’s Imports Index registered 55.6% in August, up 2.5 percentage points compared to the 53.1% reported for July. “Imports expanded for the second consecutive month, reflecting increased U.S. factory demand. The index reached its highest level of expansion since June 2018, when it registered 59%,” said Fiore.
KPI — September: Consumer Trends
Key Performance Indicators Report — September 2020


