- KPI – September 2026: The Brief
- KPI – September 2026: State of Manufacturing
- KPI – September 2026: State of Business – Automotive Industry
- KPI – September 2026: State of the Economy
- KPI – September 2026: Recent Vehicle Recalls
Below is a synopsis of consumer sentiment, confidence, demand and income/spending trends.
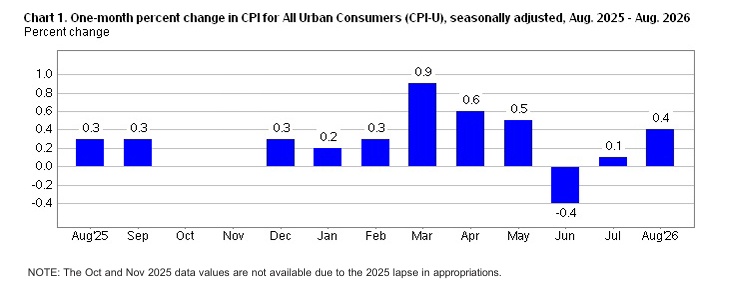
In August, the Consumer Price Index for All Urban Consumers (CPI-U) increased 0.4% on a seasonally-adjusted basis after rising 0.1% in July, according to the U.S. Bureau of Labor Statistics. Over the last 12 months, the all-items index increased 3.4% before seasonal adjustment.
Data shows the index for gasoline rose 3.9%, accounting for over one third of the monthly all-items increase. The index for energy rose 2.1% month-over-month and the shelter index inched up 0.3% after rising 0.1% in July. The index for food and food-away-from-home edged up 0.1% and 0.3% month-over-month, respectively.
The index for all-items-less-food-and-energy rose 0.3% after increasing 0.2% in July. Indexes on the rise include communication, lodging away from home, airline fares, education, as well as used cars and trucks. Conversely, the indexes for medical care and motor vehicle insurance were among the major indexes to decrease in August.
The all-items index rose 3.4% for the 12 months ending August. The all-items-less-food-and-energy index rose 2.4% year-over-year, following a 2.5% increase over the 12 months ending July. The energy index increased 16.3% year-over-year, while the food index increased 2.7%.
Sentiment
The University of Michigan Survey of Consumers—a survey consisting of approximately 50 core questions covering consumers’ assessments of their personal financial situation, buying attitudes and overall economic conditions—registered 51.7 in August and posted a preliminary reading of 47.8 in September.
“Year-ahead expectations for both personal finances and business conditions plunged. With a resurgence in fuel prices and trade tensions, consumers anticipate greater pressures on their pocketbooks to come,” says Joanne Hsu, director at Survey of Consumers.
Data shows the decrease in sentiment was consistent across the political spectrum, with Democrats and Republicans alike posting sizable declines, while Independents were little changed from August.
“Five-year expected business conditions remained stable at readings well below their historical average, suggesting that consumers believe that emerging risks this month may not have further worsened the long-run outlook,” Hsu says. “Overall, sentiment is now 16% below February, prior to the start of the Iran conflict, and 13% lower than a year ago.”
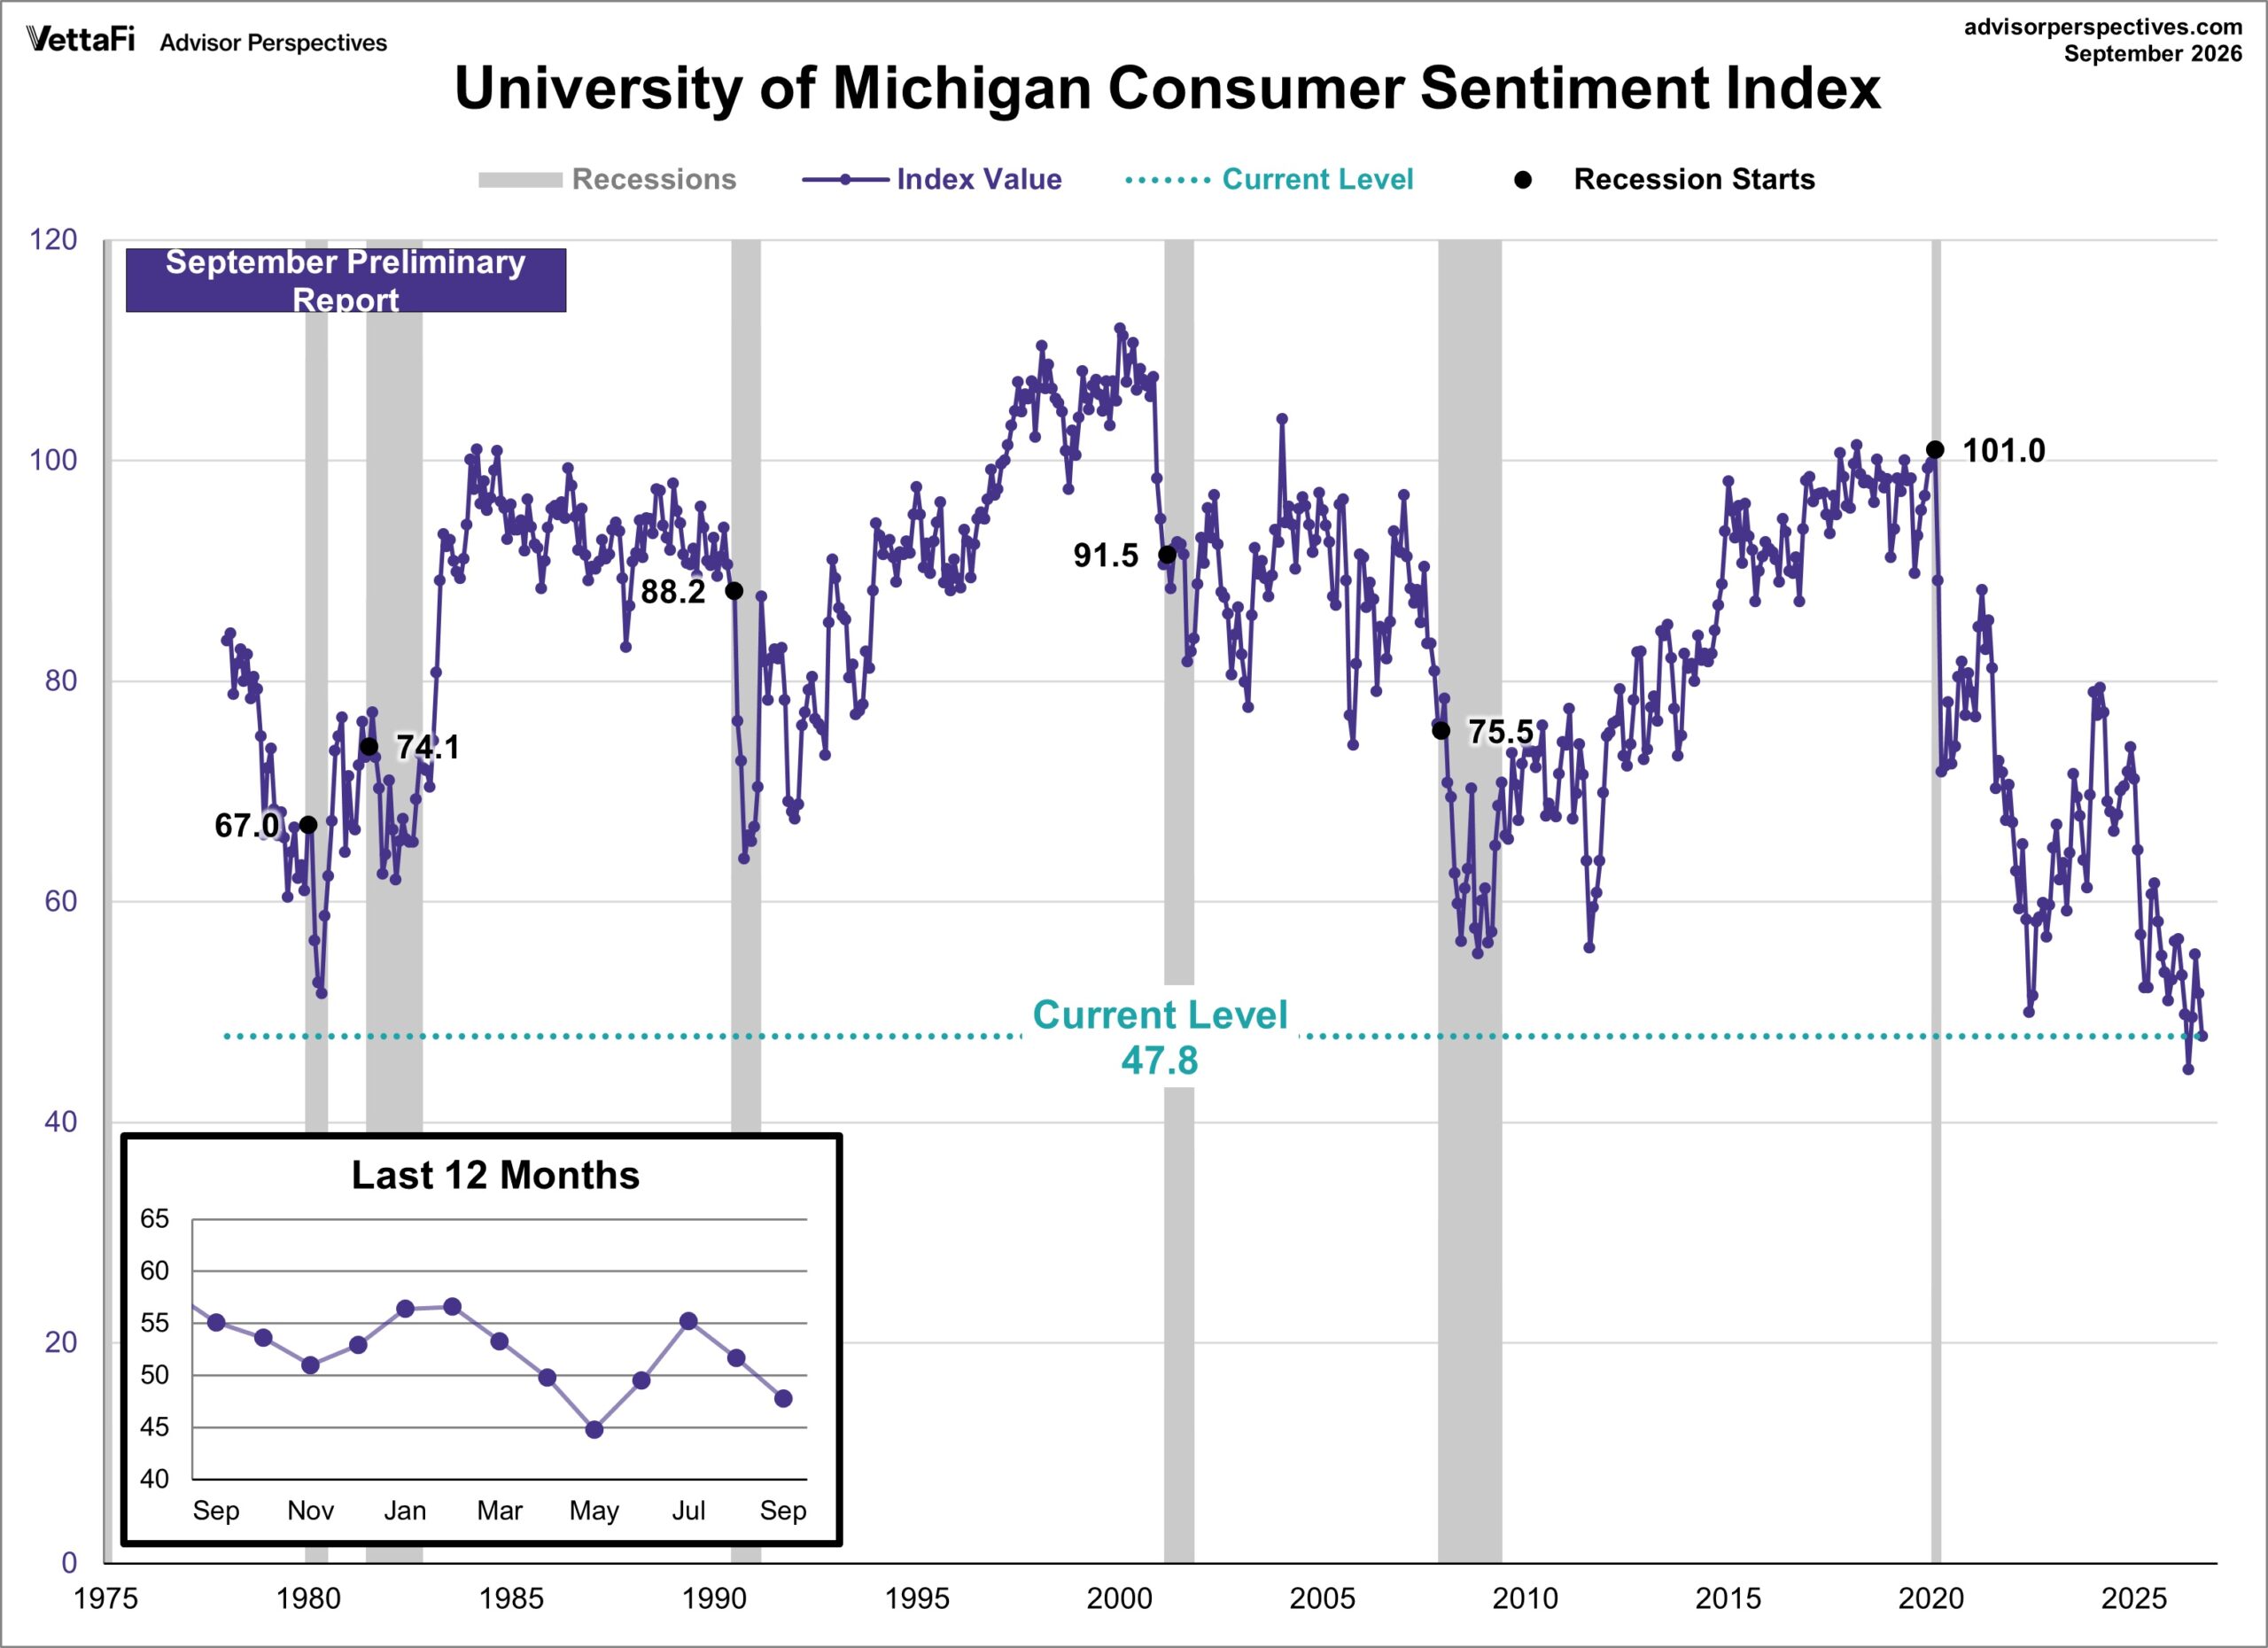 To put today’s report in historical context, consumer sentiment is currently 42.9% below its average reading of 83.6 (arithmetic mean) and 41.9% below its geometric mean of 82.3, based on data dating back to 1978.
Key Takeaways, Courtesy of Survey of Consumers:
- Year-ahead inflation expectations jumped from 4% last month to 4.6% this month, the highest reading since June. The current reading substantially exceeds the 3.4% seen in February before the Iran conflict began, along with all 2024 readings.
- Long-run inflation expectations ticked up to 3.4%, ending three consecutive months at 3.3%. These expectations remain higher than their 2024 range of 2.8% to 3.2%.
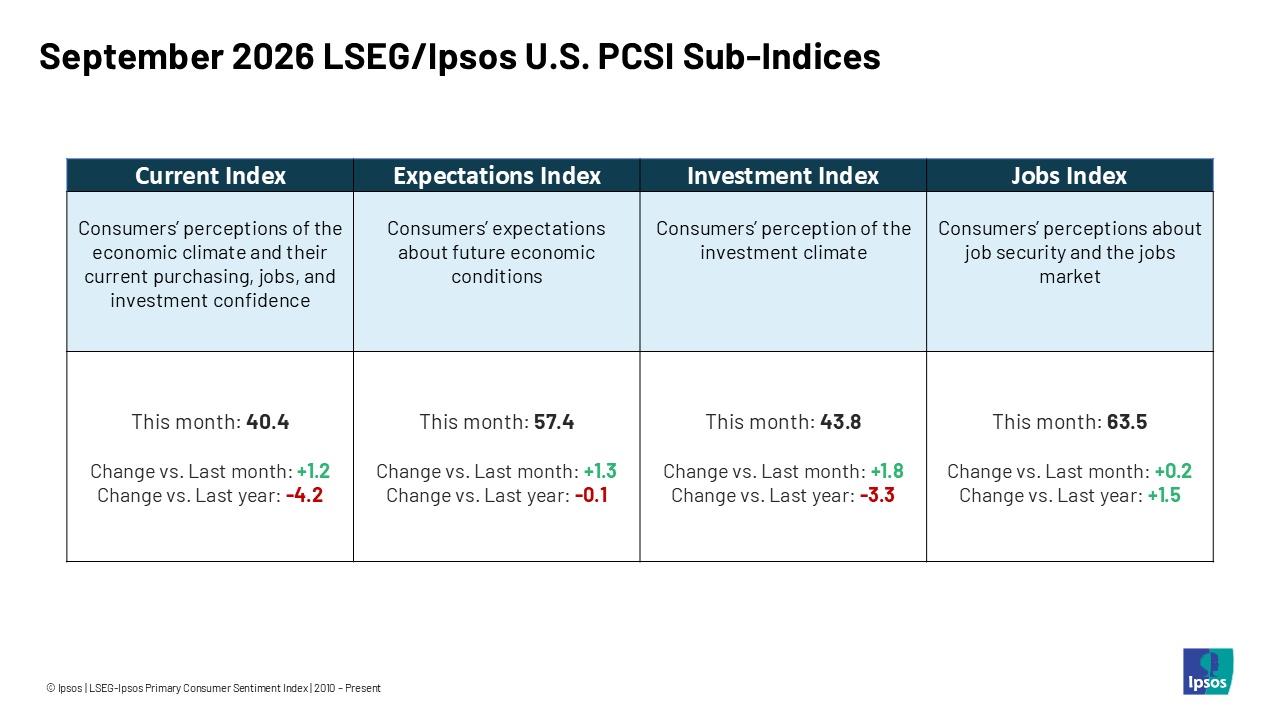 The LSEG/Ipsos Primary Consumer Sentiment Index for September 2026 is at 50.5. Fielded from Aug. 21-Sept. 1, 2026, the Index is up 1.1 points from last month.
Consumer Income & Spending
According to the U.S. Bureau of Economic Analysis (BEA), personal income, disposable income (DPI) and personal consumer expenditures (PCE) increased $115.1 billion (0.4% at a monthly rate), $125.9 billion (0.5%) and $36.3 billion (0.2%) in July, respectively.
Personal outlays—the sum of PCE, personal interest payments and personal current transfer payments— increased $36.6 billion in July. Personal saving was $712 billion, while the personal saving rate—personal saving as a percentage of DPI—registered 3%.
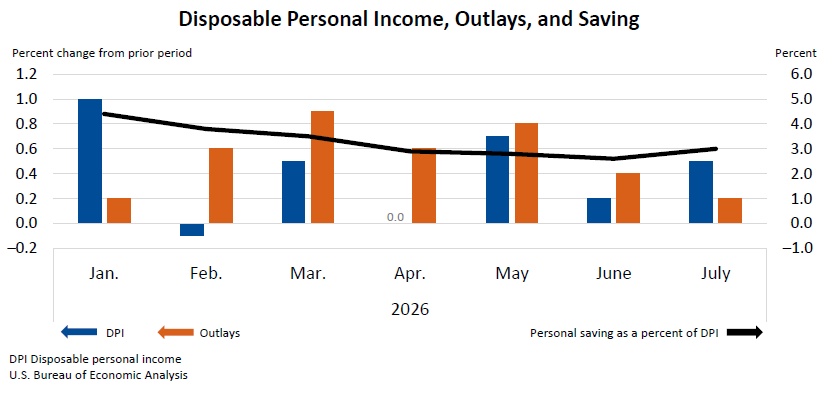
Key Takeaways, Courtesy of the U.S. Bureau of Economic Analysis:
- In July, the $36.3 billion increase in current-dollar PCE reflected an increase of $86.2 billion in spending on services that was partly offset by a decrease of $49.9 billion in spending on goods.
- Real PCE increased $1.3 billion (less than 0.1% at a monthly rate).
- From the preceding month, the PCE price index increased 0.2%. Excluding food and energy, the PCE price index also increased 0.2%.
- The PCE price index increased 3.7% year-over-year. Excluding food and energy, the PCE price index increased 3.3% from one year ago.