KPI — September 2022: The Brief

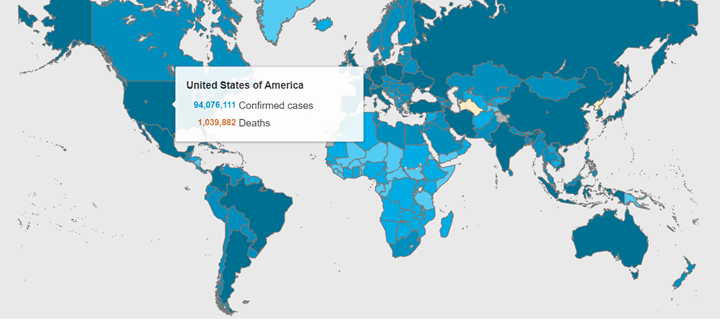
More than 607 million COVID-19 cases and 6.4 million deaths are confirmed across the globe. Vaccination efforts remain a top priority among health and government officials, with an ultimate goal of reaching herd immunity. Approximately 68% of Americans are fully vaccinated, according to recent CDC data. Experts estimate 70%-85% of the population must be vaccinated in order to reach herd immunity.
To date, nearly 95 million cases were reported across the U.S, with California, Texas and Florida claiming the highest numbers, according to Statista. COVID-19 restrictions vary by state, county and even city. Review a comprehensive list of current restrictions here.
COVID-19 Cases by Country

The Conference Board Consumer Confidence Index® increased in August, following three consecutive monthly declines. The Index now stands at 103.2 (1985=100), up from 95.3 in July. The Present Situation Index – based on consumers’ assessment of current business and labor market conditions – improved to 145.4 from 139.7 last month. The Expectations Index – based on consumers’ short-term outlook for income, business and labor market conditions – increased to 75.1 from 65.6.
The Consumer Sentiment Index – a survey consisting of approximately 50 core questions covering consumers’ assessments of their personal financial situation, buying attitudes and overall economic conditions – increased slightly month-over-month from 51.5 in July to 58.2 in August – rising 13% month-over-month but down 17% year-over-year, according to the University of Michigan Survey of Consumers. Lower-income consumers, who have fewer resources to buffer against inflation, posted particularly large gains on all index components.
According to Pew Research, seven-in-ten Americans view inflation as “a very big problem for the country,” followed by the affordability of health care and violent crime. A recent Gallup poll further supports the assessment, with approximately 56% of U.S. households reporting economic stress due to inflation – up from 49% in January and 45% in November. The findings, according to CNBC, indicate runaway inflation is eating into the bedrock of the American economy – the middle-class – and even eroding the financial stability of more well-heeled households. Gallup says one-in-four consumers noted cutbacks on spending to cope with inflation, while almost 20%^ point to paring costs by canceling vacations and driving less. With consumer spending accounting for approximately 70 cents on every $1 dollar of economic activity, inflation could have detrimental impacts.
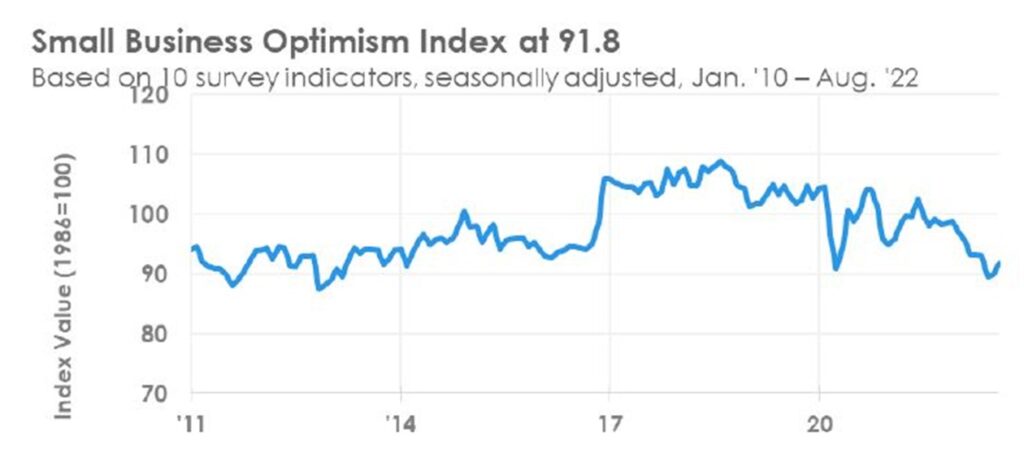
While the NFIB Small Business Optimism Index rose 1.9 points in August to 91.8, it marks the eighth consecutive month below the 48-year average of 98. Moreover, 29% of owners reported inflation as their single most important problem in operating their business, a decrease of eight points from July’s highest reading since the fourth quarter of 1979.
“The small business economy is still recovering from the pandemic while inflation continues to be a serious problem for owners across the nation,” says Bill Dunkelberg, NFIB chief economist. “Owners are managing the rising costs of utilities, fuel, labor, supplies, materials, rent and inventory to protect their earnings. The worker shortage is impacting small business productivity as owners raise compensation to attract better workers.”
Key Data Points, Courtesy of NFIB:
- Small business owners expecting better business conditions over the next six months improved 10 points from July to a net negative 42%, the highest level since February 2022, but a dismal outlook.
- Nearly 50% of owners reported job openings that were hard to fill, unchanged from July and an historically high.
- Approximately 32% of owners reported supply chain disruptions having a significant impact on their business. Another 33% report a moderate impact and 23% report a mild impact. Only 11% report no impact from recent supply chain disruptions.
- The net percent of owners raising average selling prices decreased three points to a net 53% (seasonally adjusted), still a very inflationary outcome.
- The net percent of owners who expect real sales to be higher increased 10 points from July to a net negative 19%, but owners still want to hire.
- The Uncertainty Index increased seven points to 74.

Professionals in the automotive, RV and powersports industries remain steadfast in their efforts to evolve their business models and grow their brands in the face of adversity. As such, the monthly Key Performance Indicator Report serves as an objective wellness check on the overall health of our nation, from the state of manufacturing and vehicle sales to current economic conditions and consumer trends. Below are a few key data points explained in further detail throughout the report:
This Month’s Top Takeaways:
- The July Manufacturing PMI® registered 52.8%, down 0.2 percentage point from a reading of 53% in June and the same as July, according to supply executives in the latest Manufacturing ISM® Report On Business®.
- The Consumer Price Index for All Urban Consumers (CPI-U) rose 0.1% in August on a seasonally adjusted basis after being unchanged in July, noted the U.S. Bureau of Labor Statistics. Over the last 12 months, the all items index increased 8.3% before seasonal adjustment.
- LMC Automotive reports Global Light Vehicle (LV) sales continued its gradual improved to 94 million units per year in August, but remains down 3.8% year-over-year. While China continues to recover and spur an increased global selling rate, other major markets like Europe and the U.S. remain hamstrung by ongoing supply chain disruptions.
- Total new vehicle sales for August 2022, including retail and non-retail transactions, are projected to reach 1,136,800 units – a 0.6% increase from August 2021. Comparing the sales volume without adjusting for the number of selling days translates to an increase of 4.6% from 2021, according to a joint forecast from D. Power and LMC Automotive.
- RV wholesale shipments are projected to reach 498,800 units by year-end 2022 – a 16.9% decline from the record 600,240 shipped in 2021, according to the Fall 2022 issue of RV RoadSigns, the quarterly forecast prepared by ITR Economics for the RV Industry Association. Staring down the barrel at 2023, the forecast suggests shipments will range between 409,000 and 429,000 units, with a most likely year-end total of 419,000 – a 16% decline from this year’s projected total. “The softening economic backdrop, as measured by declines in ITR’s system of leading indicators, is impacting the RV shipment forecast,” reports RV PRO. “Coupled with lower savings rates, elevated inflation and higher interest rates, these factors are putting pressure on consumer budgets, leading some to reduce or postpone spending on discretionary items such as RVs.”
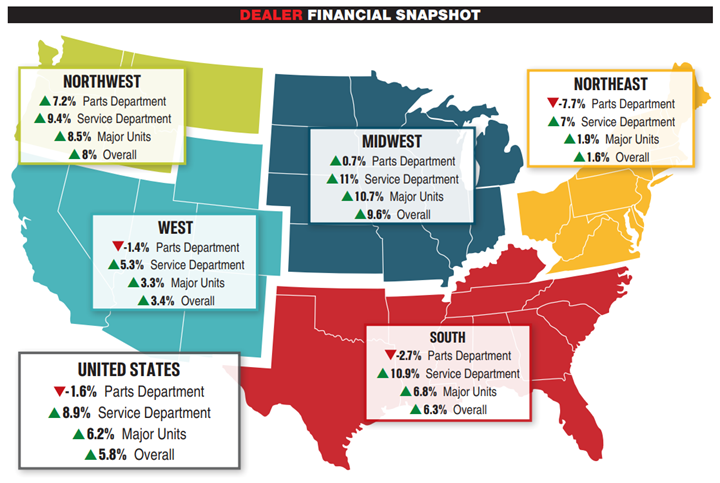
- Powersports Business reports dealerships across the country experienced, on average, an overall revenue growth in July. Revenue from new and pre-owned unit sales increased an average of 6.2%, with the Northwest (8.5% growth) posting a notable bump. Every region recorded an increase in new and pre-owned unit sales for July 2022 versus year-over-year. The service department averaged an 8.9% increase, more than last month’s average 7.4%. The Midwest increased 11%, with the South right behind at 10.9%. Parts sales declined by 1.6%, similar to last month. The Northeast decreased in parts revenue, with a 7.7% slump. The South (2.7% decrease) and the West (1.4% decrease) followed the declining trend. The Northwest (7.2% growth) and the Midwest (0.7% growth) saw an increase in every department for July 2022 versus year-over-year. Combined, the average dealership experienced an overall revenue increase of 5.8% in July, a similar percentage compared to June at 6%. The Midwest saw the largest overall revenue increase at 9.6% on average and the Northwest followed with an 8% increase.

KPI — September 2022: State of Business — Automotive Industry
Key Performance Indicators Report — September 2022


