KPI — October 2021: State of the Economy

The Conference Board forecasts U.S. real GDP growth will slow to 3.5% (annualized rate) in Q3 2021, compared to 6.7% growth in Q2 2021. Furthermore, the 2021 annual growth estimate was revised to 5.7% (year-over-year), a downgrade from last month’s outlook. Looking ahead, the Conference Board projects the economy will grow by 3.8% (year-over-year) in 2022 and 3% (year-over-year) in 2023.
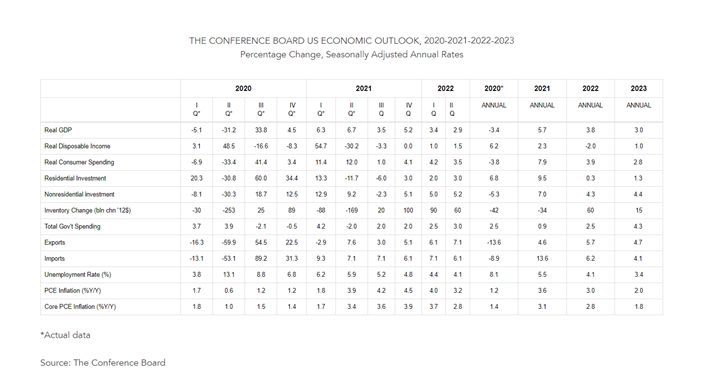
Important Takeaways, Courtesy of The Conference Board:
- Consumer spending will be a key driver of growth in Q4 2021, but recent declines in consumer confidence may impact GDP growth in Q3 2021.
- Bottlenecks in global supply chains continue to wreak havoc.
- Year-over-year inflation rates likely will continue to remain high through the end of 2021 and into early 2022 due to sizeable base effects. Recent increases in energy prices also will keep inflation from falling more rapidly over the winter months as well.
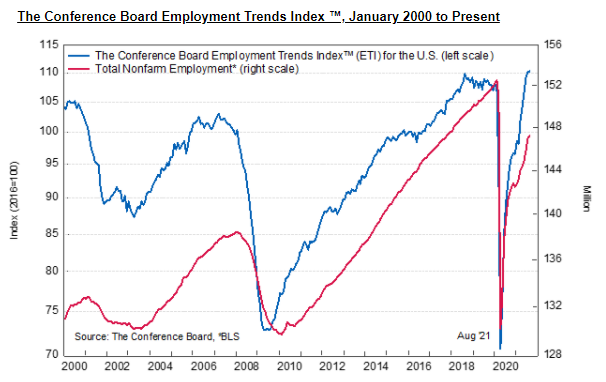
The Conference Board Employment Trends Index™ (ETI) increased for the sixth consecutive month in August, though the rate of increase has fallen. The index now stands at 110.37, up from 109.89 in July.
COVID-19 infection rates and labor market challenges pose serious threats to employment growth. According to a survey of the National Federation of Independent Business, 50% of small employers reported difficulty filling positions in August, an all-time high accompanied by rapidly rising wages.
Employment
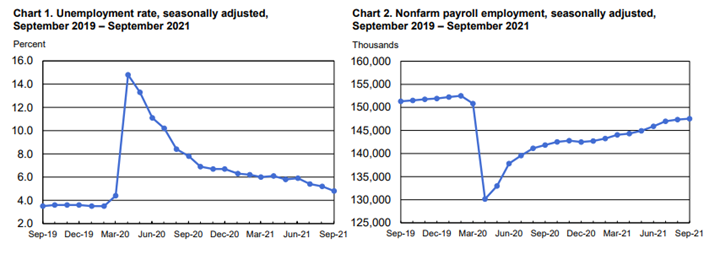
Total nonfarm payroll employment increased by 194,000 in September, compared to a forecast of 500,000. Record high job leaver statistics combined with burdensome mandates and the highest inflation in nearly 13 years has some politicians blaming failed economic policy.
Though the current jobs report fell short of expectations, the Administration points to positive growth in private-sector jobs – at plus 317,000. Moreover, the unemployment rate fell by .4 percentage point to 4.8%, according to the U.S. Bureau of Labor Statistics.
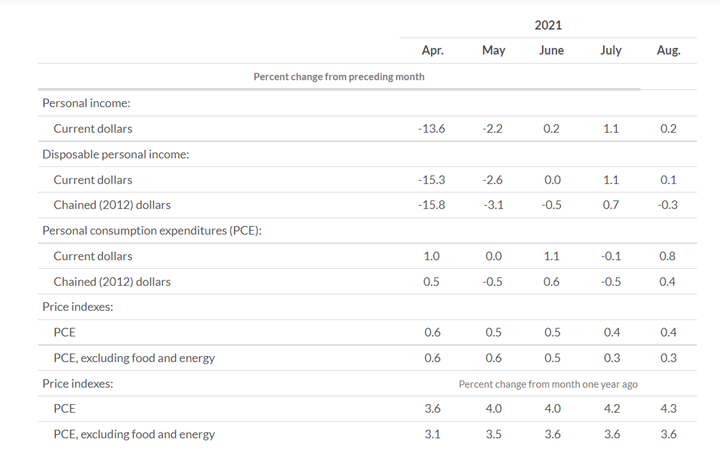
According to the U.S. Bureau of Economic Analysis (BEA), the increase in personal income during August primarily reflected increases in compensation of employees and government social benefits. Personal income increased $35.5 billion (.2%); disposable personal income (DPI) increased $18.9 billion (.1%); and personal consumption expenditures (PCE) increased $130.5 billion (.8%). Personal outlays increased $132.6 billion, while personal saving registered $1.71 trillion and the personal saving rate – personal saving as a percentage of disposable personal income – was 9.4%.
Important Takeaways, Courtesy of the Bureau of Labor Statistics:
- Among the unemployed, the number of job leavers – that is, unemployed persons who quit or voluntarily left their previous job and began looking for new employment – rose by 242,000 to 4.3 million; the quit rate hit a record high 2.9%.
- The number of persons on temporary layoff (1.1 million) changed little in September. This measure is down considerably from the high of 18 million in April 2020 but is 374,000 above the February 2020 level.
- Among the unemployed, the number of permanent job losers declined by 236,000 to 2.3 million in September but is 953,000 higher than in February 2020. The number of long-term unemployed (those jobless for 27 weeks or more) decreased by 496,000 in September to 2.7 million but remains 1.6 million higher than in February 2020; it is the second-largest single-month decline in history, with the largest being in July. The long-term unemployed accounted for 34.5% of the total unemployed in September.
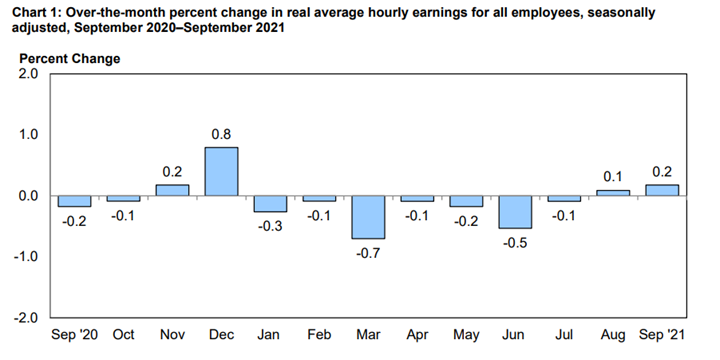
According to the U.S. Bureau of Labor Statistics, real average hourly earnings for all employees increased .2% from August to September, seasonally adjusted. This results from an increase of .6% in average hourly earnings combined with an increase of .4% in the Consumer Price Index for All Urban Consumers (CPI-U). Real average weekly earnings increased .8% month-over-month due to the change in real average hourly earnings combined with an increase of .6% in the average workweek. Real average hourly earnings decreased .8%, seasonally adjusted, from September 2020 to September 2021. The change in real average hourly earnings combined with no change in the average workweek resulted in a .8% decrease in real average weekly earnings over this period.
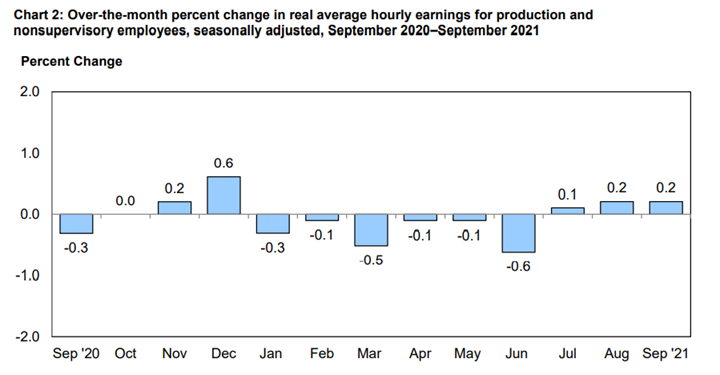
According to the U.S. Bureau of Labor Statistics, real average hourly earnings for production and nonsupervisory employees increased .2% from August to September, seasonally adjusted. This results from a .5% increase in average hourly earnings combined with an increase of .4% in the Consumer Price Index for Urban Wage Earners and Clerical Workers (CPI-W). Real average weekly earnings increased .4% over the month due to the change in real average hourly earnings combined with an increase of .3% in average weekly hours. From September 2020 to September 2021, real average hourly earnings decreased .4%, seasonally adjusted. The change in real average hourly earnings combined with a .3% increase in the average workweek resulted in a .1% decrease in real average weekly earnings over this period.
By Demographic
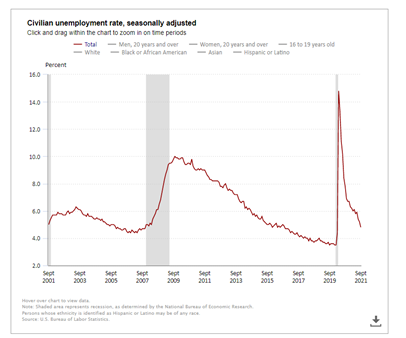
Unemployment rates among the major worker groups: adult women – 4.2%; adult men – 4.7%; teenagers – 11.5%; Asians – 4.2%; Whites – 4.2%; Hispanics – 6.3%; and Blacks – 7.9%.
Image Source: Civilian unemployment rate (bls.gov)
By Industry
Nonfarm employment has increased by 17.4 million since April 2020 but remains down by 5 million, or 3.3%, compared to pre-pandemic levels.
This month, notable job gains occurred in leisure and hospitality, professional and business services, retail trade, transportation and warehousing.
Important Takeaways, Courtesy of the U.S. Bureau of Labor Statistics:
- Employment in transportation and warehousing increased by 47,000 in September, consistent with gains the past two months. Job gains continued in warehousing and storage (+16,000), couriers and messengers (+13,000) and air transportation (+10,000). Employment in transportation and warehousing is 72,000 above its pre-pandemic level in February 2020.
- Employment in manufacturing increased by 26,000 in September, with gains in fabricated metal products (+8,000), machinery (+6,000) and printing and related support activities (+4,000). These gains were partially offset by a decline of 6,000 in motor vehicles and parts. Manufacturing employment is down by 353,000 since February 2020.
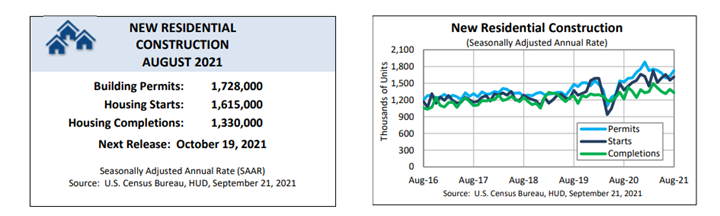
- Construction employment rose by 22,000 in September but has shown little net change this year. Employment in construction is 201,000 below its February 2020 level.
- Employment in wholesale trade increased by 17,000, almost entirely in the durable goods component (+16,000). Employment in wholesale trade is down by 159,000 since February 2020.
- Employment in health care changed little in September (-18,000). Job losses occurred in nursing and residential care facilities (-38,000) and hospitals (-8,000), while ambulatory health care services added jobs (+28,000). Employment in health care is down by 524,000 since February 2020, with nursing and residential care facilities accounting for about four-fifths of the loss. Vaccination mandates are expected to impact the employment number further.
Review all employment statistics here.
KPI — October 2021: Consumer Trends
Key Performance Indicators Report — October 2021


