KPI — October 2021: Consumer Trends
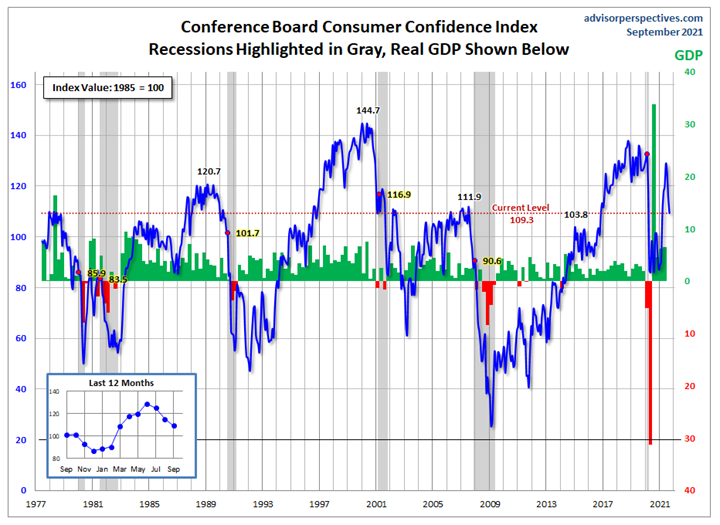
The Conference Board Consumer Confidence Index® declined again in September, following decreases in both July and August. The Index now stands at 109.3 (1985=100), a dip from 115.2 in August. The Present Situation Index – based on consumers’ assessment of current business and labor market conditions – fell to 143.4 from 148.9 last month. The Expectations Index – based on consumers’ short-term outlook for income, business and labor market conditions – dropped to 86.6 from 92.8.
“Consumer confidence dropped in September as the spread of the Delta variant continued to dampen optimism,” said Lynn Franco, senior director of economic indicators at The Conference Board. “Concerns about the state of the economy and short-term growth prospects deepened, while spending intentions for homes, autos and major appliances all retreated again. Short-term inflation concerns eased somewhat but remain elevated. Consumer confidence is still high by historical levels – enough to support further growth in the near-term – but the Index has now fallen 19.6 points from the recent peak of 128.9 reached in June. These back-to-back declines suggest consumers have grown more cautious and are likely to curtail spending going forward.”
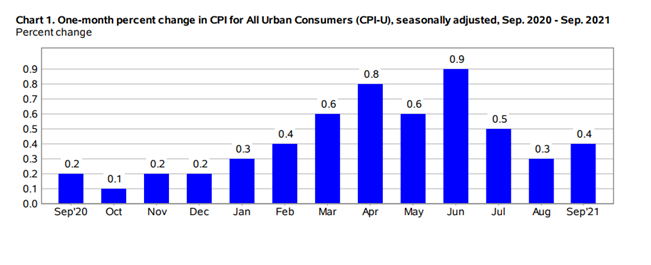
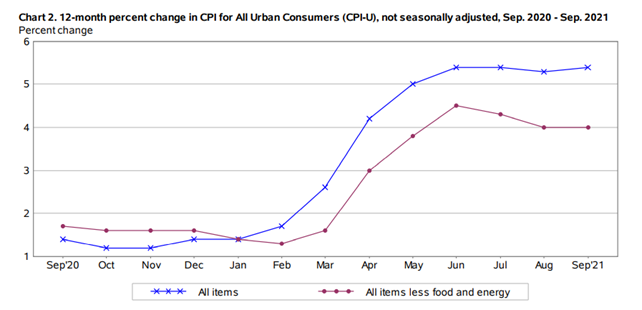
The Consumer Price Index for All Urban Consumers (CPI-U) increased .4% in September on a seasonally adjusted basis after rising .3% in August, according to the U.S. Bureau of Labor Statistics. Over the last 12 months, the all items index increased 5.4% before seasonal adjustment. The indexes for food and shelter rose in September and, together, contributed more than half of the monthly all items seasonally adjusted increase. The index for all items less food and energy rose 4% over the last 12 months, the same increase as the period ending August. The energy index rose 24.8% over the last 12 months, and the food index increased 4.6% during the period.
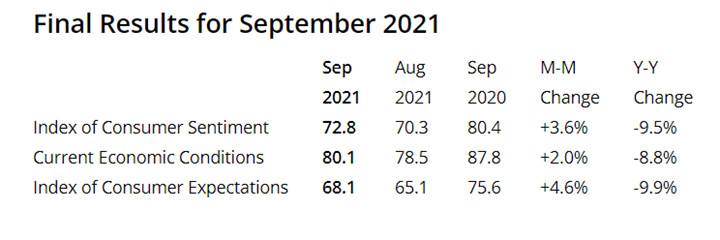
There are some inconsistencies between The Conference Board Consumer Confidence Index® and The Consumer Sentiment Index, the latter of which is a survey consisting of approximately 50 core questions covering consumers’ assessments of their personal financial situation, buying attitudes and overall economic conditions. While consumer confidence took another nosedive in September, consumer sentiment is treading water – posting a slight month-over-month increase of 72.8 in September, according to the University of Michigan Survey of Consumers.
“Consumer sentiment edged upward in late September, although the overall gain still meant the continuation of depressed optimism,” noted Richard Curtin, chief economist at Survey of Consumers.
Dissatisfaction with incessant inflation and unfavorable long-term prospects for the national economy, along with an ongoing battle with COVID-19, show in the numbers.
Recent research published by David Blanchflower of Dartmouth College and Alex Bryson of the University College London shows consumer expectation indexes from the Conference Board and the University of Michigan often predict economic downturns up to 18 months in advance. If the trend holds true, “clear downward movements in consumer expectations” during the past six months point to the U.S. steering into a recession, according to Blanchflower and Bryson.
The hiring situation implies otherwise, with an unemployment rate falling and the economy adding jobs – though at a slower-than-expected rate; however, the U.S. government has played a pivotal role in “propping up the labor market,” according to economists. Time will tell if such numbers are a mirage of recovery through an infusion of federal spending or true economic growth.
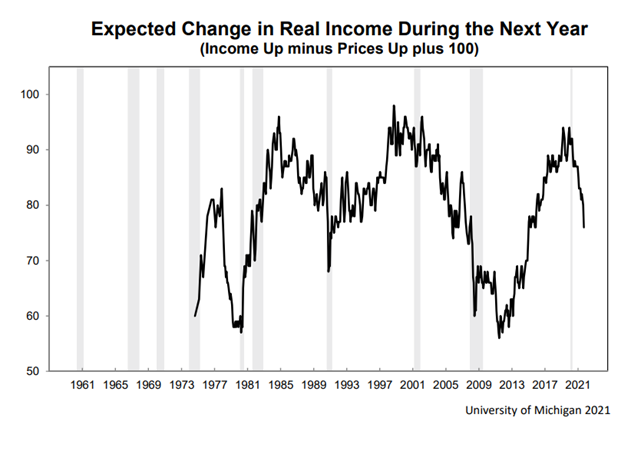
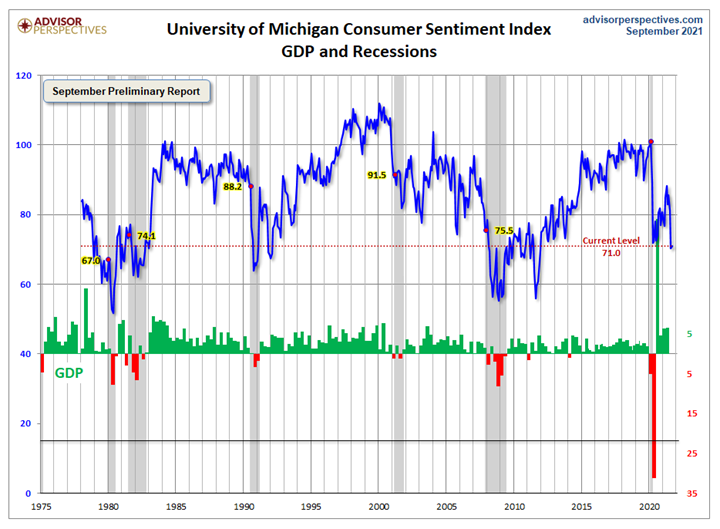
Jill Mislinski of Advisor Perspectives – a leading interactive publisher for Registered Investment Advisors (RIAs), wealth managers and financial advisors – put the recent consumer sentiment report into a larger historical context as a coincident indicator of the economy. “Toward this end, we have highlighted recessions and included GDP. The regression through the index data shows the long-term trend and highlights the extreme volatility of this indicator. Statisticians may assign little significance to a regression through this sort of data. But the slope resembles the regression trend for real GDP shown below, and it is a more revealing gauge of relative confidence than the 1985 level of 100 that the Conference Board cites as a point of reference,” she said.
This chart provides additional perspective about consumer attitudes, according to Advisor Perspectives.
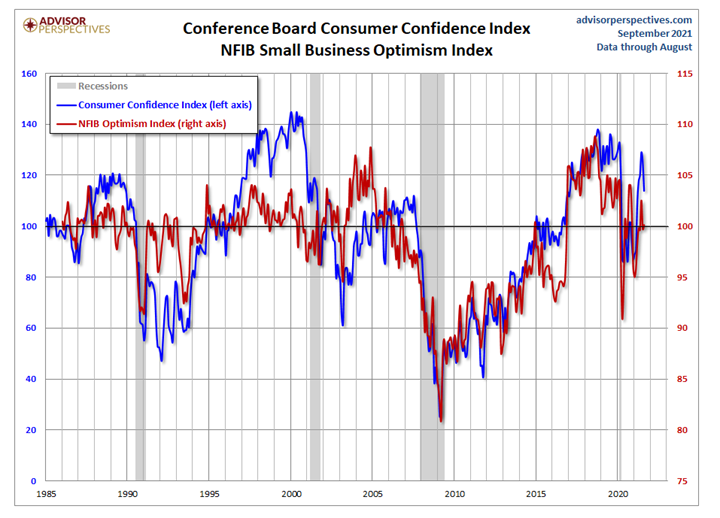
Presented above is the correlation between consumer confidence and small business sentiment, the latter by way of the National Federation of Independent Business (NFIB) Small Business Optimism Index. As the chart illustrates, the two have tracked one another quite closely since the onset of the Financial Crisis, although a spread appears infrequently, with the most recent spread showing up 2015 through present, explained Mislinski.
Consumer Spending
Despite falling consumer confidence numbers amid the recent rise in COVID-19 infections, shoppers are continuing to spend, according to Jack Kleinhenz, chief economist at the National Retail Federation (NRF).
“With consumer spending accounting for roughly two-thirds of U.S. gross domestic product, all eyes are closely watching shoppers’ ability to drive the economy,” Kleinhenz said. “If consumer finances are any indication, there’s reason to be optimistic: Households remain in good shape, with consumers in the aggregate actually underspending relative to current income. Even though enhanced unemployment benefits have expired and are no longer providing a boost to personal income, the loss is easily offset by the savings stockpiled since the coronavirus pandemic began.”
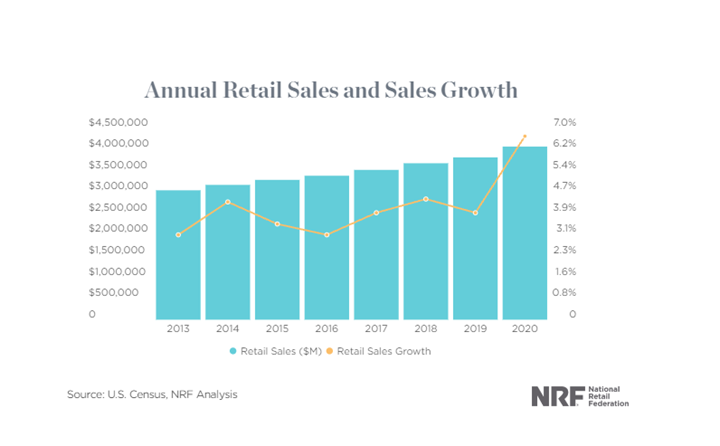
For the first eight months of the year, sales, as calculated by NRF, were up 15% over the same period in 2020. That is consistent with NRF’s revised forecast that 2021 retail sales should grow between 10.5 and 13.5% over 2020 to between $4.44 trillion and $4.56 trillion.
Retail sales recorded a win in August, as consumer demand outpaced the pandemic, supply chain disruptions and other factors affecting spending, according to NRF. Kleinhenz said consumers remain a bedrock of economic recovery “despite a trifecta of macroeconomic headwinds, including tapering off of government stimulus, elevated COVID-19 infections and ongoing supply chain challenges in the form of shortages of labor and goods.”
NRF’s calculation of retail sales – which excludes automobile dealers, gasoline stations and restaurants to focus on core retail – showed August was up 2.3% seasonally adjusted from July and up 12% unadjusted year-over-year. That compared with a month-over-month decrease of 1.8% and a year-over-year increase of 8.9% in July. NRF’s numbers were up 11.4% unadjusted year-over-year on a three-month moving average.
As such, NRF President and CEO Matthew Shay remains confident in “the historic strength of consumers” and fully expects a record year for retail sales, as well as a strong holiday season for retailers.
Click here to review the latest report from NRF.
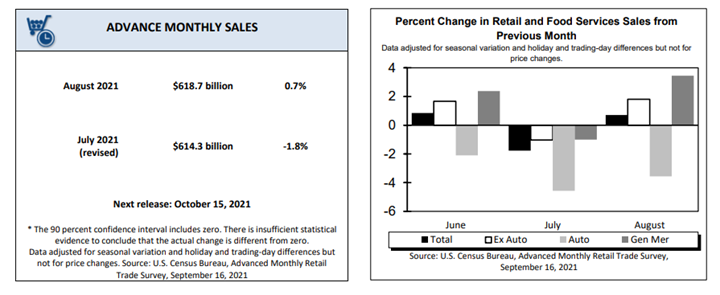
Advance estimates of U.S. retail and food services sales for August 2021 – adjusted for seasonal variation and holiday and trading-day differences but not for price changes – were $618.7 billion, an increase of .7% (±.5%) from the previous month, and 15.1% (±.7%) above August 2020. Total sales for the June 2021 through August 2021 period were up 16.3% (±.5%) from the same period a year ago. The June 2021 to July 2021 percent change was revised from down 1.1% (±.5%) to down 1.8% (±.2%). Retail trade sales were up .8% (±.5%) from July 2021, and up 13.1% (±.7%) above last year. Clothing and clothing accessories stores were up 38.8% (±3.3%) from August 2020, while gasoline stations were up 35.7% (±1.6%) from last year.
Key Performance Indicators Report — October 2021