KPI — November: State of the Manufacturing Sector

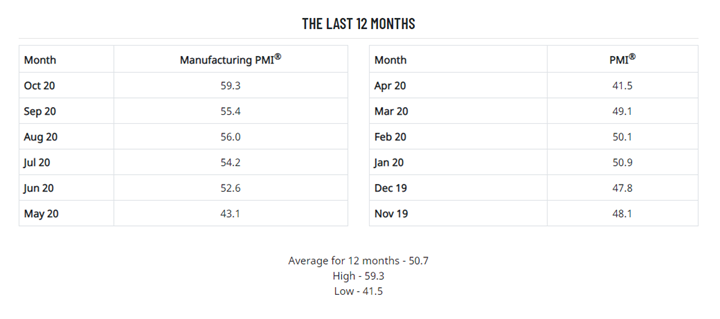
Economic activity in the manufacturing sector grew in October, with the overall economy securing a sixth consecutive month of growth, according to the nation’s supply executives in the latest Manufacturing ISM® Report On Business®. The October Manufacturing PMI® registered 59.3%, up 3.9 percentage points from the September reading of 55.4% and the highest since September 2018 (59.3%).
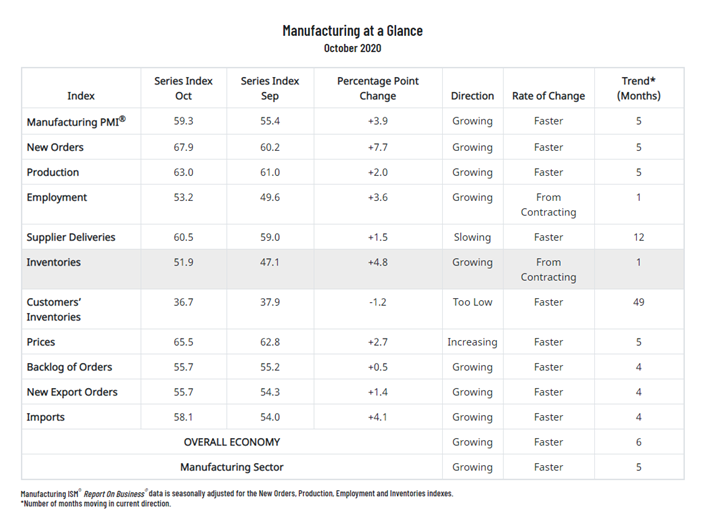
The Report On Business® measures its data using the Purchasing Manager’s Index (PMI), which is an indicator of economic health in the manufacturing sector. A reading above 50% indicates that the manufacturing economy is generally expanding, while below 50% indicates that it is generally contracting. All data and analysis are courtesy of the Institute for Supply Management.
“The manufacturing economy continued its recovery in October. Survey Committee members reported that their companies and suppliers continue to operate in reconfigured factories; with every month, they are becoming more proficient at expanding output. Panel sentiment was optimistic (two positive comments for every cautious comment), a slight decrease compared to September,” said Timothy R. Fiore, CPSM, C.P.M., Chair of the Institute for Supply Management® (ISM®) Manufacturing Business Survey Committee.
Furthermore, demand, consumption and inputs registered growth indicative of a normal expansion cycle. “While certain industry sectors are experiencing difficulties that will continue in the near term, the overall manufacturing community continues to exceed expectations,” said Fiore.
- Demand expanded, with the (1) New Orders Index growing at strong levels, supported by the New Export Orders Index expanding moderately, (2) Customers’ Inventories Index at its lowest figure since June 2010 (35.8%), a level considered a positive for future production and the (3) Backlog of Orders Index expanding at a slightly faster rate compared to the prior three months.
- Consumption (measured by the Production and Employment indexes) contributed positively (a combined 5.6-percentage point increase) to the Manufacturing PMI® calculation, with five of the top six industries continuing to expand output strongly. The Employment Index broke into expansion territory for the first time since July 2019.
- Inputs—expressed as supplier deliveries, inventories and imports—continued to indicate input-driven constraints to production expansion but at slower rates compared to September due to a return to growth in inventory levels. Inputs improved compared to September and contributed positively to the Manufacturing PMI® calculation, with a combined 6.3-percentage point increase.
Fifteen of 18 manufacturing industries reported growth in October: Apparel, Leather & Allied Products; Fabricated Metal Products; Nonmetallic Mineral Products; Food, Beverage & Tobacco Products; Plastics & Rubber Products; Machinery; Furniture & Related Products; Paper Products; Wood Products; Chemical Products; Primary Metals; Computer & Electronic Products; Transportation Equipment; Electrical Equipment, Appliances & Components; and Miscellaneous Manufacturing. The two industries reporting contraction in October are: Textile Mills; and Printing & Related Support Activities.
Commodities Up in Price: Aluminum (5); Aluminum Products; Base Oils; Copper (5); Corn; Corrugate; Ethylene; Freight (3); High-Density Polyethylene (HDPE) Products (4); Lumber (4); Plastic Products; Plastic Resins (2); Polyethylene Film; Polyethylene Resins; Polyethylene Terephthalate (PET) Bottles; Polypropylene (4); Polyvinyl Chloride; Precious Metals (4); Propylene; Soybean Products; Steel (3); Steel—Cold Rolled (2); Steel—Galvanized; Steel—Hot Rolled (2); Steel Products (2); and Wood Pallets.
Commodities Down in Price: Caustic Soda
Commodities in Short Supply: Aluminum Products; Capacitors (2); Electrical Components; Labor — Temporary; Lumber; Personal Protective Equipment (PPE)—Gloves (8); Freight; Polyvinyl Chloride; Resistors (2); and Steel Products.
Note: The number of consecutive months the commodity is listed is indicated after each item. *Indicates both up and down in price.
What Respondents Are Saying
- “COVID-19 continues to have an effect on supplier support and operations, more from a decreased labor perspective rather than unavailable material.” (Computer & Electronic Products)
- “Business continues to be robust. Sales are greater than expectations and cost pressures are modest. There is posturing by suppliers on market price increases for corrugated and polypropylene, yet no firm price increases at this time. We expect a strong finish to 2020 and a solid start in 2021.” (Chemical Products)
- “Sales continue to be strong—up 4% this September compared to September 2019. The year-to-date level is still 21% below last year due to the [COVID-19] shutdown, but sales are stronger than expected and forecast to stay strong through the first quarter of 2021.” (Transportation Equipment)
- “Increased production due to stores stocking up for the second wave of COVID-19.” (Food, Beverage & Tobacco Products)
- “Continue to see increases in customer demand. We still are not back to pre-COVID-19 levels but are continually improving.” (Fabricated Metal Products)
- “Construction materials have leveled off but continue to be at an all-time high. Mills for board sheet stock have pushed out lead times citing increasing backlogs related to the pandemic and increased supply in the housing market.” (Furniture & Related Products)
- “Business is almost back to normal levels; however, customers are still cautious with capital spending.” (Machinery)
- “Business levels have just about returned to pre-COVID-19 levels. Our company is remaining conservative with fixed-cost spending, knowing the uncertainties that lie ahead with COVID-19 and its potential impact globally.” (Miscellaneous Manufacturing)
- “October order books are the strongest we have seen in the past six months.” (Paper Products)
- “We continue to see stronger month-over-month orders in plastic injection molding.” (Plastics & Rubber Products)
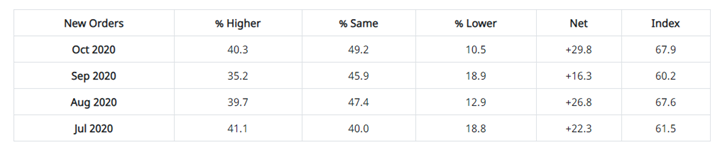
ISM®’s New Orders Index registered 67.9% in October, an increase of 7.7 percentage points compared to the 60.2% reported in September. This indicates that new orders grew for the fifth consecutive month. The reading of 67.9% is the highest reading since January 2004 (70.6%). Except for June 2020, the month-over-month change of 7.7 percentage points is the greatest positive movement since March 2009 (8.6 percentage points). Over time, a New Orders Index above 52.5% is generally consistent with an increase in the Census Bureau’s series on manufacturing orders (in constant 2000 dollars).
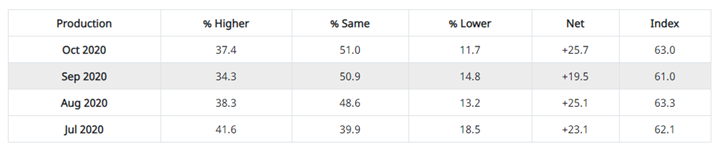
The Production Index registered 63% in October, two percentage points higher than the September reading of 61%, indicating growth for the fifth consecutive month and the fourth consecutive month above 60%. Over time, an index above 51.7% is generally consistent with an increase in the Federal Reserve Board’s Industrial Production figures.
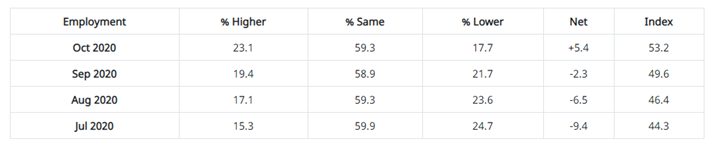
ISM®’s Employment Index registered 53.2% in October, 3.6 percentage points higher than the September reading of 49.6%. “Following 14 consecutive months of contraction, the Employment Index moved back into expansion territory. This marks the sixth consecutive month of improvement since the index’s low of 27.5% registered in April,” said Fiore. “Continued strong new-order levels and an expanding backlog signify potential employment strength for the balance of the fourth quarter. For the second straight month, survey panelists’ comments indicate that significantly more companies are hiring or attempting to hire than those reducing labor forces,” he continued. Over time, an Employment Index above 50.8% is generally consistent with an increase in the Bureau of Labor Statistics (BLS) data on manufacturing employment.

The delivery performance of suppliers to manufacturing organizations was slower in October, as the Supplier Deliveries Index registered 60.5%. This is 1.5 percentage points higher than the 59% reported in September. “Suppliers continue to struggle to deliver, with deliveries slowing at a faster rate compared to September. Transportation challenges and continuing challenges in supplier labor markets are still constraining production growth. The Supplier Deliveries Index reflects the difficulties suppliers continue to experience due to COVID-19 impacts amid expanding new orders and production. Supplier constraints are not expected to diminish soon and represent a continuing hurdle to production output and inventories growth,” explained Fiore. A reading below 50% indicates faster deliveries, while a reading above 50% indicates slower deliveries.
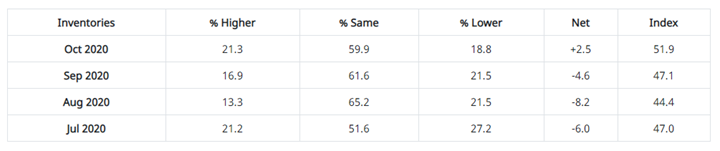
The Inventories Index registered 51.9% in October, 4.8 percentage points higher than the 47.1% reported for September. Inventories grew after three straight months of contraction. “Inventory growth in light of ongoing supplier constraints indicate that the supply chain is beginning to improve its performance in meeting production demand,” said Fiore. Over time, an Inventories Index greater than 44.3% is generally consistent with expansion in the Bureau of Economic Analysis (BEA) figures on overall manufacturing inventories (in chained 2000 dollars).
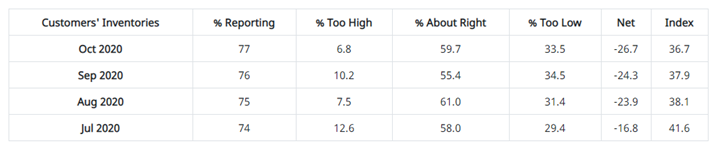
ISM®’s Customers’ Inventories Index registered 36.7% in October, 1.2 percentage points lower than the 37.9% reported for September, indicating that customers’ inventory levels were considered too low. “Customers’ inventories are too low for the 49th consecutive month and moved further into ‘too low’ territory in October, a positive for future production growth. For a third straight month, the index has been at its lowest levels in more than a decade (a reading of 35.8% in June 2010),” said Fiore.
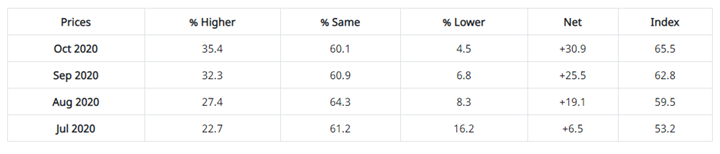
The ISM® Prices Index registered 65.5%, an increase of 2.7 percentage points compared to the September reading of 62.8%, indicating raw materials prices increased for the fifth consecutive month. “The Prices index achieved its highest level of expansion since October 2018, when the index registered 71.6%. Aluminum, copper, steel, transportation costs, corrugate, food products and plastics all recorded price increases,” said Fiore. Over time, a Prices Index above 52.5% is generally consistent with an increase in the Bureau of Labor Statistics (BLS) Producer Price Index for Intermediate Materials.
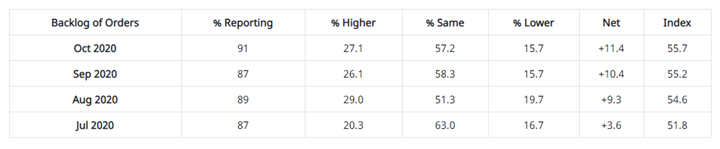
ISM®’s Backlog of Orders Index registered 55.7% in October, a 0.5-percentage point increase compared to the 55.2% reported in September, indicating order backlogs expanded for the fourth consecutive month after four straight months of contraction. “Backlogs expanded at slightly faster rates in October, indicating that new-order intakes were sufficient to fully offset production outputs and maintain an acceptable level of backlog. The index achieved its highest reading since November 2018 (56.4%),” said Fiore.
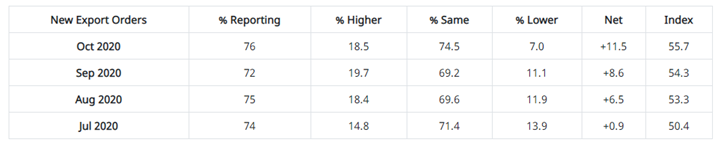
ISM®’s New Export Orders Index registered 55.7% in October, up 1.4 percentage points compared to the September reading of 54.3%. “The New Export Orders Index grew for the fourth consecutive month at a faster rate and reached its highest level since September 2018 (56%). With four of the six big industry sectors expanding (Food, Beverage & Tobacco Products; Transportation Equipment; Fabricated Metal Products; and Chemical Products), new export orders were a positive factor to the growth in new orders,” explained Fiore.
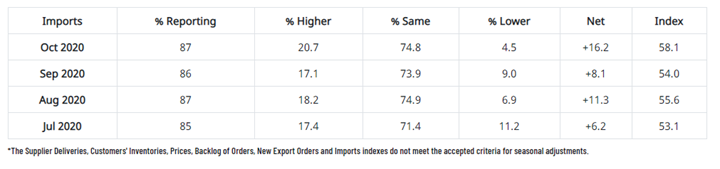
ISM®’s Imports Index registered 58.1% in October, up 4.1 percentage points compared to the 54% reported for September. “Imports expanded for the fourth consecutive month and at a faster rate, reflecting continued increases in U.S. factory demand. This is the index’s highest level in more than two years (a reading of 59% in June 2018),” said Fiore.
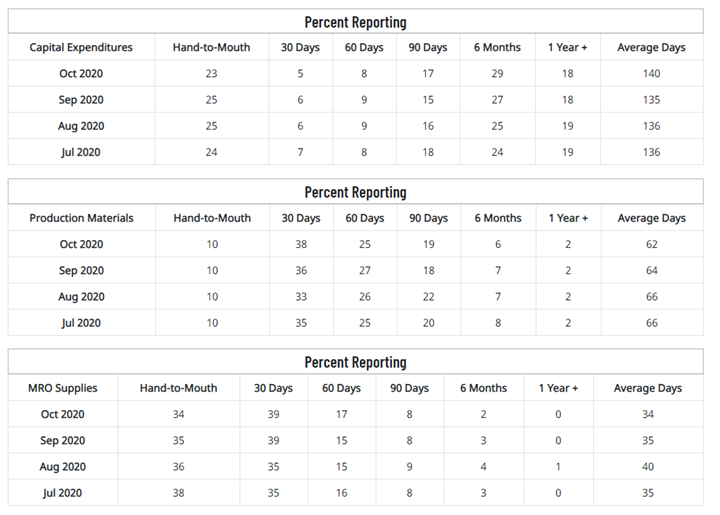
Average commitment lead time for Capital Expenditures increased in October by five days to 140 days. Average lead time for Production Materials decreased in October by two days to 62 days. Average lead time for Maintenance, Repair and Operating (MRO) Supplies decreased in October by one day to 34 days.
KPI — November: Consumer Trends
Key Performance Indicators Report — November 2020


