KPI — November: Consumer Trends

Below is a synopsis of consumer confidence, sentiment and spending trends, as well as national housing market and retail analysis.
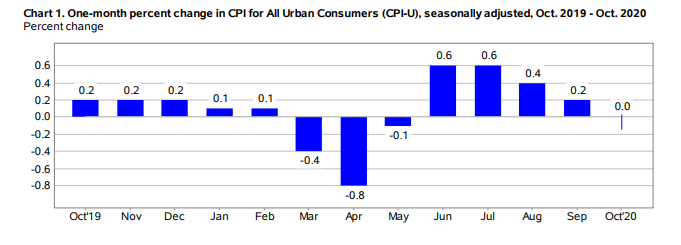
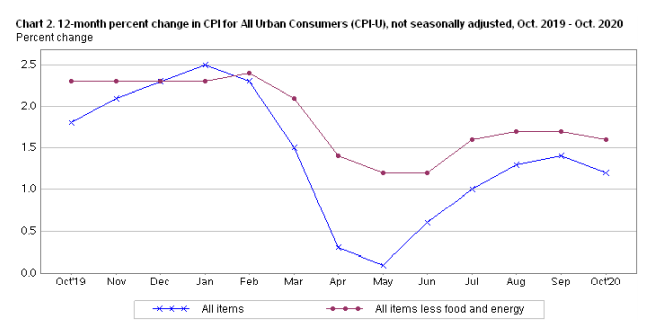
The Consumer Price Index for All Urban Consumers (CPI-U) was unchanged in October on a seasonally adjusted basis after rising 0.2% in September, according to the U.S. Bureau of Labor Statistics. The all items index increased 1.2% (before seasonal adjustment) over the last 12 months, a slightly smaller increase compared to the 1.4% rise for the 12-month period ending September.
Component indexes were mixed, showing many offsetting increases and decreases. For example, the food index rose 0.2%, with the food away from home index increasing by 0.3% and a smaller 0.1% rise in the food at home index. The energy index rose 0.1% in October as the index for electricity increased 1.2%.
Important Takeaways, Courtesy of the U.S. Bureau of Labor Statistics:
- The index for all items less food and energy was unchanged, following an increase of 0.2% in September.
- The index for shelter increased 0.1%, which was offset by a 0.4% decrease in the index for medical care.
- The indexes for airline fares, recreation and new vehicles were among those to rise, while the indexes for motor vehicle insurance, apparel and household furnishings and operations declined.
- The index for all items less food and energy rose 1.6% over the last 12 months after rising 1.7% in September.
- The food index increased 3.9% over the last 12 months, while the energy index declined 9.2%.
Consumer Sentiment, Confidence and Spending
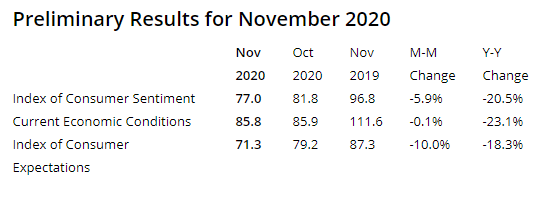
The Consumer Sentiment Index—a survey consisting of approximately 50 core questions that cover consumers’ assessments of their personal financial situation, buying attitudes and overall economic conditions—finished at 81.8 in October. However, the index is trending down (77.0) in November’s preliminary reading conducted by the University of Michigan Survey of Consumers.
In these tumultuous times, the market is more vulnerable than ever and reacts quickly to disapproving news.
“Consumer sentiment fell in early November as consumers judged future economic prospects less favorably, while their assessments of current economic conditions remained largely unchanged. The outcome of the presidential election, as well as the resurgence in COVID-19 infections and deaths, were responsible for the early November decline,” said Richard Curtin, chief economist for the University of Michigan Survey of Consumers.
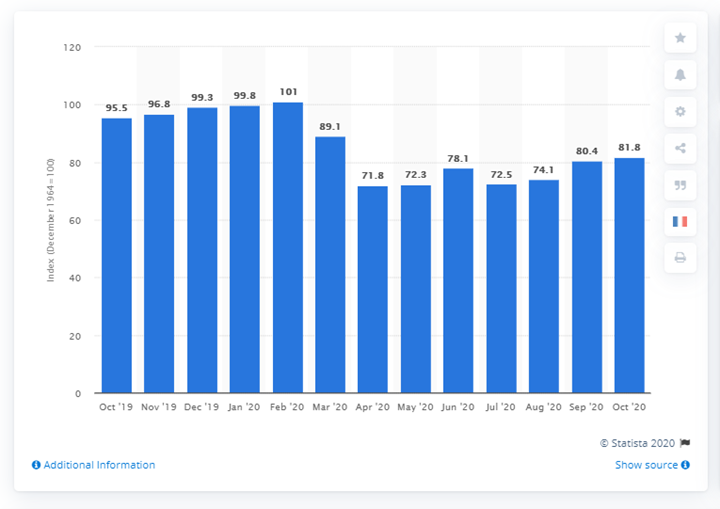
This graphic by Statista shows the U.S. Consumer Sentiment Index from October 2019 to October 2020. The index is normalized to have a value of 100 in December 1964 and based on a monthly survey of consumers, conducted in the continental United States. It consists of about 50 core questions, which cover consumers’ assessments of their personal financial situation, their buying attitudes and overall economic conditions. The Consumer Sentiment Index stood at 81.8 in October 2020.
The Conference Board Consumer Confidence Index® decreased in October as well, following a sharp increase. The Index now stands at 100.9 (1985=100), down from 101.3 a month prior.
“Consumers’ assessment of current conditions improved while expectations declined, driven primarily by a softening in the short-term outlook for jobs,” said Lynn Franco, senior director of economic indicators at The Conference Board. “There is little to suggest that consumers foresee the economy gaining momentum in the final months of 2020, especially with COVID-19 cases on the rise and unemployment still high.”
The part of the index that measures present conditions, which is based on consumers’ assessment of current business and labor market conditions, increased from 98.9 to 104.6. However, consumers were less optimistic this month about the future, as the expectations index dipped to 98.4 in October from 102.9 last month. Factors including the recent rise in coronavirus cases across the U.S., along with ongoing elevated job losses and uncertainty over the presidential election, may have played a part in consumers’ apprehension about the future. –Associated Press
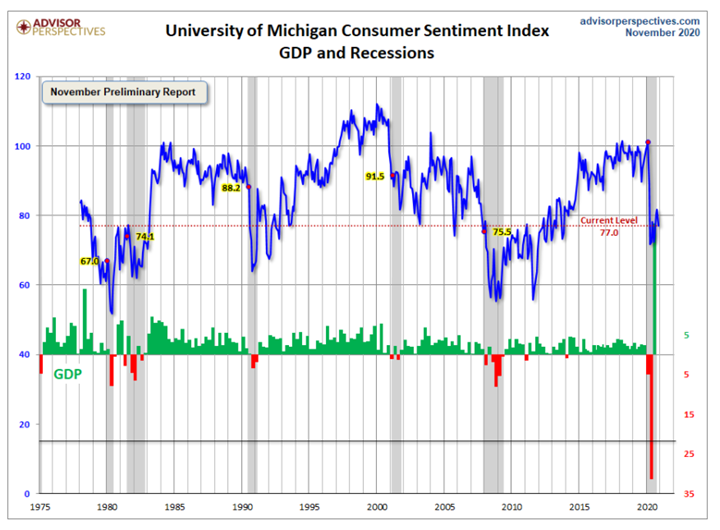
This is a long-term perspective on this widely watched indicator. Recessions and real GDP are included to help evaluate the correlation between the Michigan Consumer Sentiment Index and the broader economy, explained Advisor Perspectives, a leading interactive publisher for Registered Investment Advisors (RIAs), wealth managers and financial advisors.
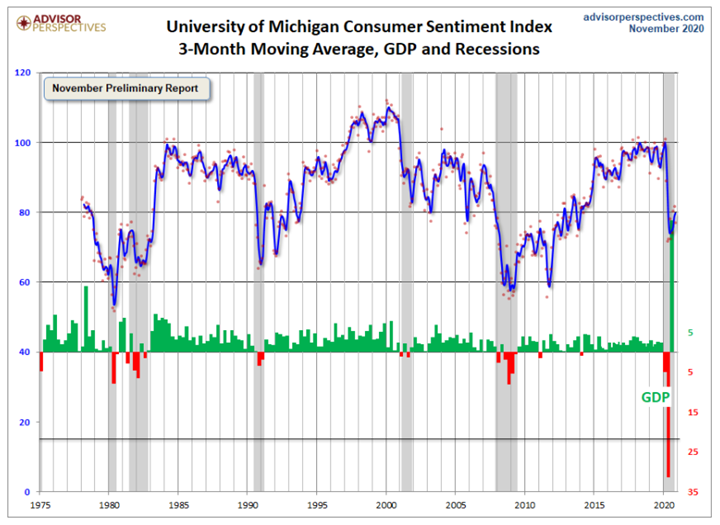
Jill Mislinski of Advisor Perspectives put the recent consumer sentiment report into larger historical context. Consumer sentiment is 10.7% below the average reading (arithmetic mean) and 9.7% below the geometric mean. The current index level is at the 26th percentile of the 515 monthly data points in this series. Note that this indicator is somewhat volatile, with a 3.0-point absolute average monthly change. The latest data point saw a 4.8-point decrease from the previous month. For a visual sense of the volatility, here is a chart with the monthly data and a three-month moving average.
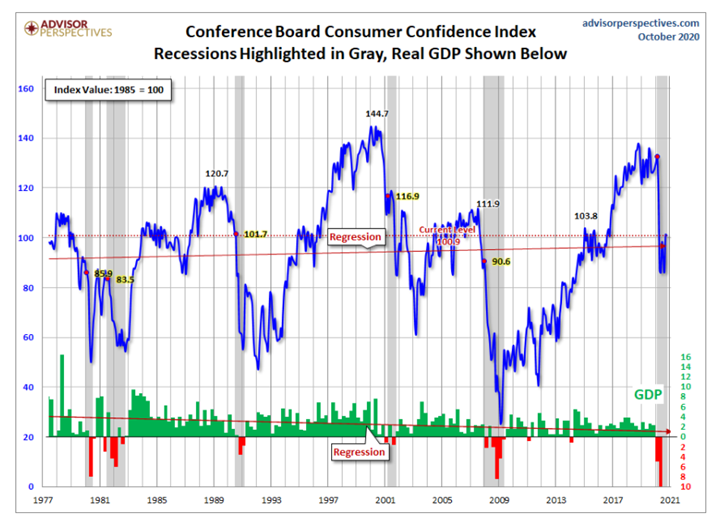
For the sake of comparison, here is a chart of the Conference Board’s Consumer Confidence Index (monthly update here). The Conference Board Index is the more volatile of the two, but the broad pattern and general trends have been remarkably similar to the Michigan Index, according to Mislinski of Advisor Perspectives.
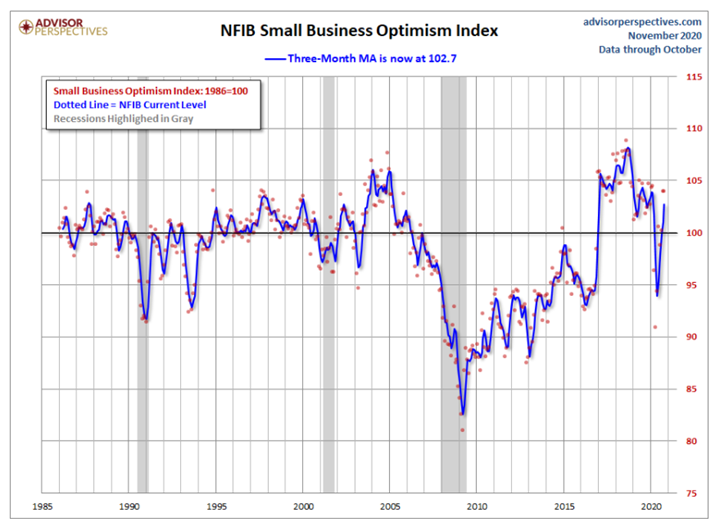
And finally, the prevailing mood of the Michigan survey also is similar to the mood of small business owners, as captured by the NFIB Business Optimism Index (monthly update here).
Consumers are anxious about rising COVID-19 cases, a continuing stalemate on additional fiscal stimulus and the unresolved status regarding control of the U.S. Senate, noted MarketWatch. However, “We appear to be moving closer to the other side of this pandemic,” added Keith Lerner, chief market strategist at SunTrust Advisory Services, a unit of Truist Financial. “We are likely in the very early innings of a multi-year economic expansion—monetary policy remains very supportive and relative valuations continue to favor stocks.”
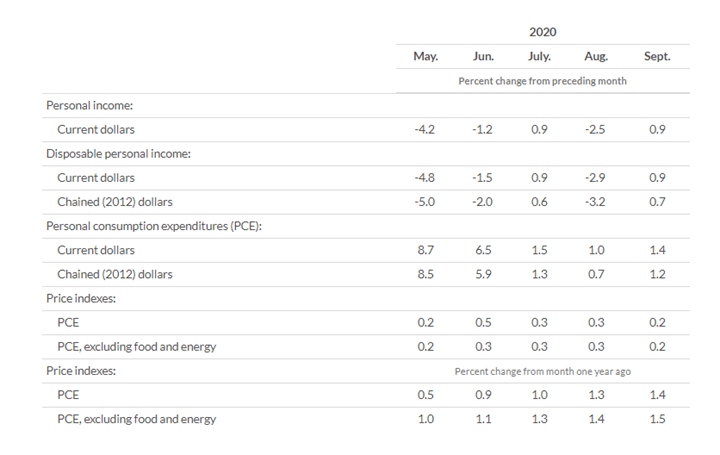
Also positive, recent reporting from the Bureau of Economic Analysis estimates personal income increased $170.3 billion (0.9%), disposable personal income (DPI) increased $150.3 billion (0.9%), personal consumption expenditures (PCE) increased $201.4 billion (1.4%) and personal outlays increased $217.5 billion. Additionally, personal saving hit $2.51 trillion in September and the personal saving rate—personal saving as a percentage of disposable personal income—registered 14.3%.
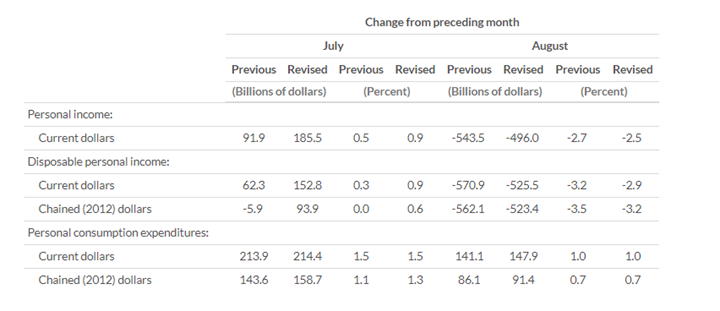
In September, the $159.2 billion increase in real PCE—the value of the goods and services purchased by, or on the behalf of, U.S. residents—reflected an increase of $109.9 billion in spending for goods and a $61 billion increase in spending for services. Likewise, a bump in personal income reflected increases in proprietors’ income, compensation of employees and rental income of persons that were partly offset by a decrease in government social benefits, explained the Bureau of Economic Analysis.
With nearly 70% of the U.S. economy tied to consumer spending, an increase in personal and disposable income is a bright spot. Retail sales grew for the sixth consecutive month during October, with sales improving thanks to an economy in recovery and consumers beginning their holiday shopping early, according to the National Retail Federation.
“October retail sales remained on track despite the pandemic continuing to affect households and businesses,” said Jack Kleinhenz, NRF chief economist.
NRF’s calculation of retail sales, which excludes automobile dealers, gasoline stations and restaurants to focus on core retail, posted a monthly increase of 0.2% seasonally adjusted and a bump of 10.6% unadjusted year-over-year. Compare that with increases of 0.9% month-over-month and 12.9% year-over-year in September, and NRF’s numbers were up 10% unadjusted year-over-year on a three-month moving average.
“The steady expansion of retail sales is good news against the background of these unusual economic circumstances and climbing virus cases in recent weeks. Early holiday shopping appears to have supported October’s increase in sales. The rise in COVID-19 cases continues to be a factor that weighs on consumer perceptions, sentiment and spending… and there could be retrenchment if we cannot thwart this latest wave,” said Kleinhenz.
Nonetheless, in contrast to the dip in confidence and sentiment reported by Surveys of Consumers and The Conference Board, “Consumers have proven their resilience and willingness to spend as we head into the heart of the holiday season and retailers continue to demonstrate their commitment and ability to ensure safe shopping environments for their customers and their associates, with deep discounts, robust inventory and great experiences whether in-store or online,” said Matthew Shay, NRF president and CEO.
Important Takeaways, Courtesy of NRF
- Online and other non-store sales were up 3.1% month-over-month seasonally adjusted and up 26.3% unadjusted year-over-year.
- Electronics and appliance stores were up 1.2% month-over-month seasonally adjusted but down 3.3% unadjusted year-over-year.
- Building materials and garden supply stores were up 0.9% month-over-month seasonally adjusted and up 17% unadjusted year-over-year.
- Health and personal care stores were down 0.1% month-over-month seasonally adjusted but up 3.1% unadjusted year-over-year.
- Grocery and beverage stores were down 0.2% month-over-month seasonally adjusted but up 11.6% unadjusted year-over-year.
- Furniture and home furnishings stores were down 0.4% month-over-month seasonally adjusted but up 5.8% unadjusted year-over-year.
- General merchandise stores were down 1.1% month-over-month seasonally adjusted but up 4.8% unadjusted year-over-year.
- Sporting goods stores were down 4.2% month-over-month seasonally adjusted but up 14.1% unadjusted year-over-year.
- Clothing and clothing accessory stores were down 4.2% month-over-month seasonally adjusted and down 11.3% unadjusted year-over-year.
Another area of spending: a super-hot housing market. Existing-home sales grew for the fourth consecutive month to a seasonally-adjusted annual rate of 6.54 million—up 9.4% from the prior month and nearly 21% from one year ago, according to the National Association of Realtors®.
Important Takeaways, Courtesy of NAR and Realtor.com®:
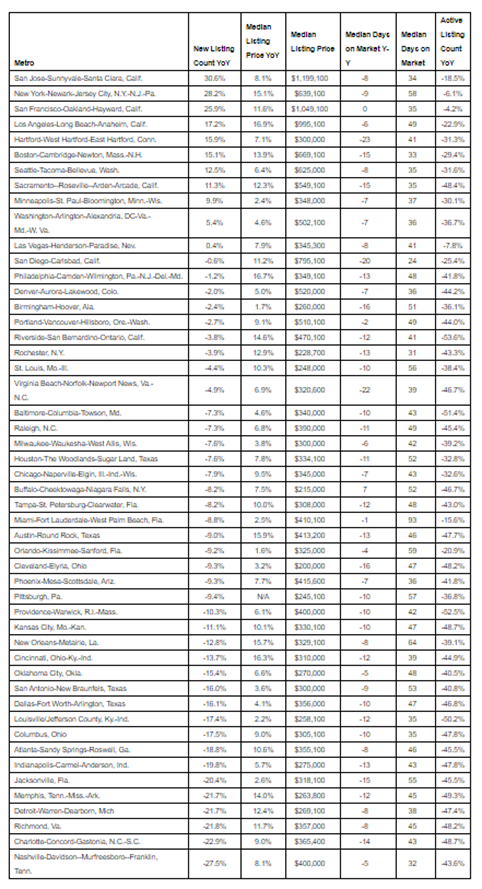
- The U.S. housing market continued to near record levels last month, thwarting the usual fall slowdown. For the first time since 2011, homes sold faster during October than September, with prices remaining at their summer peak of $350,000, according to Realtor.com®‘s Monthly Housing Trends Report.
- The median listing price was $350,000 during October, a year-over-year growth rate of 12.2%. For context, in a normal year, prices would have dropped 1-4% from summer’s price peak by October.
- While prices increased nationwide, the largest gains were seen in the Northeast (+11.4%), followed by the West (+10.1%), Midwest (+9%) and South (+7.3%).
Key Performance Indicators Report — November 2020


