KPI — November: State of the Economy

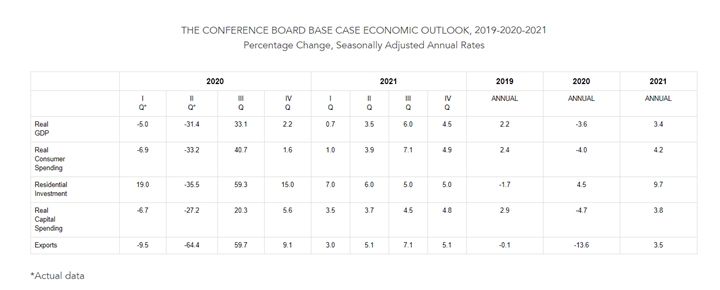
Real economic growth will increase by 2.2%* (annualized rate) in the fourth quarter of 2020, according to The Conference Board. The deceleration in recovery follows a contraction of 5% in Q1, a contraction of 31.4% in Q2 and a rebound of 33.1% in Q3. For context, the U.S. economy was still 3.5% smaller in Q3 of 2020 compared to Q4 of 2019, explained the Bureau of Economic Analysis (BEA).
Clearly, the economy continues to rebound from a deep contraction in the first half of 2020, but the Conference Board points to a variety of factors that can undermine recovery efforts in 2021. Key variables include:
- Scale of the ongoing COVID-19 resurgence and any resulting lockdowns
- Status of labor markets and household consumption
- Size and timing of additional fiscal stimulus
- Timing and availability of a COVID-19 vaccine
- Degree to which volatility in the U.S. political transition affects consumer and business confidence
As such, The Conference Board has generated three potential recovery scenarios based on specific sets of assumptions. All data and analysis is courtesy of The Conference Board.
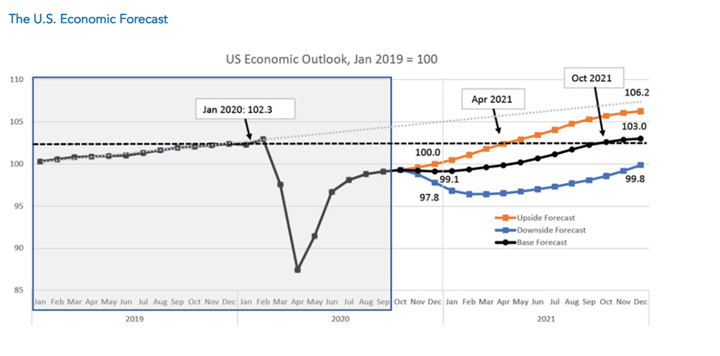
- Base Forecast: The base forecast yields real GDP growth of 2.2%* (annualized rate) during Q4, an annual contraction of 3.6% for 2020 and an annual expansion of 3.4% in 2021. “We view this scenario as the most probable. It assumes: a) a moderate rise in COVID-19 over the winter and intermittent localized lockdowns, b) limited improvement in labor markets and consumption into early 2021, c) the implementation of limited fiscal stimulus in late 1Q21/early 2Q21, d) the imminent approval of a vaccine but no broad dissemination until 2Q21 and e) a non-disruptive political transition,” stated The Conference Board. Such assumptions yield a lull in the recovery in 4Q20 and 1Q21, but a steady acceleration of economic activity that peaks in the summer months as consumers eagerly spend on services and goods that they had forgone in 2020. In this scenario U.S. monthly economic output returns to pre-pandemic levels in October 2021.
- Upside Forecast: Alternatively, a more optimistic scenario is the economy grows by 3.8% (annualized rate) in Q4, which produces an annual contraction of 3.5% in 2020. The recovery continues to accelerate in 2021, resulting in an annual expansion of 6%. This scenario assumes: a) new COVID cases level off over the coming months and do not result in lockdowns, b) a strong recovery in labor markets and consumption, c) large fiscal stimulus implemented in 1Q21, d) vaccinations becoming widely available in early 2021 and e) no political disruptions over the coming months. These assumptions lead to U.S. monthly economic output returning to pre-pandemic levels by April 2021.
- Downside Forecast: A third and more pessimistic scenario involves the U.S. economy contracting in Q4 and 1Q21 before stabilizing later in 2021. This double-dip recession scenario yields an economic contraction of 3.8% in 2020 and zero growth in 2021. It assumes a) a large spike in COVID-19 and widespread lockdowns over the winter months, b) a deterioration in labor markets and spending, c) no additional fiscal stimulus in 2021, d) no vaccine in 2021 and e) a very bumpy political transition that disrupts business and consumer confidence. Under this scenario, U.S. monthly economic output does not recover to pre-pandemic levels until sometime in 2022. In addition to the upside and downside risks outlined above, The Conference Board is monitoring several others as well. Additional downside risks include rising evictions and foreclosures creating financial stress on banks, high stress on state and local government budgets and an exacerbation of already high levels of inequality. Upside risks include an acceleration in digital transformation that improves future productivity.
Employment
Total nonfarm payroll employment rose by 638,000 in October, with the unemployment rate declining to 6.9%. “Improvements in the labor market reflect the continued resumption of economic activity that had been curtailed due to the coronavirus (COVID-19) pandemic and efforts to contain it,” explained the U.S. Bureau of Labor Statistics.
- Among the unemployed, the number of persons on temporary layoff fell by 1.4 million to 3.2 million.
This measure is down considerably from the high of 18.1 million in April but is 2.4 million higher than in February.
- The number of permanent job losers stood at 3.7 million in October—an insignificant month-over-month change but 2.4 million higher than in February.
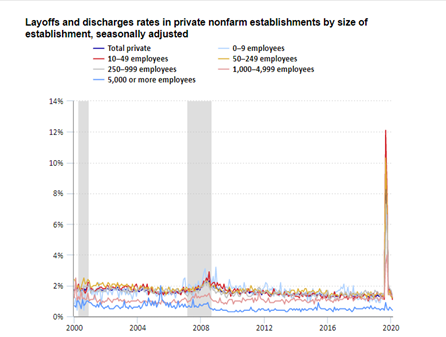
According to the U.S. Bureau of Labor Statistics, the layoffs and discharges rate in private nonfarm establishments reached a historical high of 8.8% in March 2020 as the COVID-19 pandemic began. The rate remained high in April at 6.9%. Layoffs and discharges rates in May, June, July and August were similar to those before the pandemic. Establishments with 10 to 49 employees had the highest layoffs and discharges rates in March and April, followed by establishments with 50 to 249 employees. Establishments with 1,000 to 4,999 employees experienced increases in their layoffs and discharges rates in March and April, but the rates were lower than those for smaller and medium-sized establishments. By August, there was little difference in layoffs and discharges rates by establishment size, except for the largest establishments. The rate for establishments with 5,000 or more employees reached 0.9% in March 2020. The rate was 0.4% in August, around the same rate it has been for much of its history since December 2000.
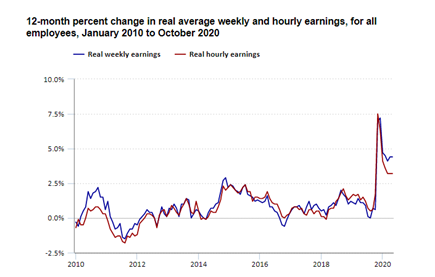
Additionally, recent reporting shows real average hourly earnings increased 3.2% for the year ended October. The change in real average hourly earnings combined with an increase of 1.2% in the average workweek resulted in a 4.4% increase in real average weekly earnings over this period, explained the U.S. Bureau of Labor Statistics. Furthermore, real average hourly earnings for production and nonsupervisory employees increased 3.2% from October 2019 to October 2020. The change in real average hourly earnings combined with a 1.8% increase in the average workweek resulted in a 5% increase in real average weekly earnings over this period.
By Demographic
Unemployment rates declined in October among all major worker groups: adult women—6.5%, adult men—6.7%, teenagers—13.9%, Whites—6%, Asians—7.6%, Hispanics—8.8% and Blacks—10.8%.
For comparison, here is the demographic data from September: adult men—7.4%, adult women—7.7%, teenagers—15.9%, Whites—7%, Asians—8.9%, Hispanics—10.3% and Blacks—12.1%.
By Industry
In October, the unemployment rate declined by one percentage point to 6.9%, while the number of unemployed persons fell by 1.5 million to 11.1 million. Both measures have declined for six consecutive months but are nearly twice their February levels (3.5% and 5.8 million, respectively), according to the U.S. Bureau of Labor Statistics.
Notable job gains occurred in leisure and hospitality, professional and business services, retail trade, as well as construction; employment in government declined.
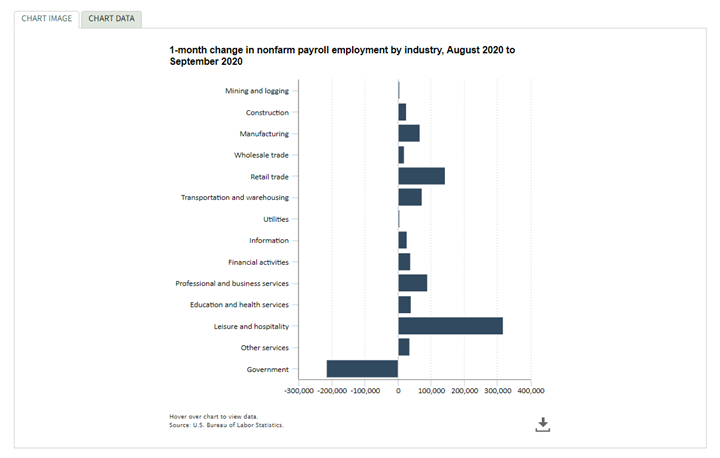
Important takeaways, courtesy of the U.S. Bureau of Labor Statistics:
- Employment in leisure and hospitality increased by 271,000, with gains in food services
and drinking places (+192,000); arts, entertainment and recreation (+44,000); and accommodation (+34,000). Leisure and hospitality added 4.8 million jobs since April, but employment in the industry is down by 3.5 million since February.
- Professional and business services added 208,000 jobs, with temporary help services (+109,000) accounting for about half of the gain. Employment also increased in services to buildings and dwellings (+19,000), computer systems design and related services (+16,000), as well as management and technical consulting services (+15,000). Employment in professional and business services is 1.1 million below its February level.
- Retail trade added 104,000 jobs, with almost one-third of the gain in electronics and appliance stores (+31,000). Employment also rose in motor vehicle and parts dealers (+23,000), furniture and home furnishings stores (+14,000), clothing and clothing accessories stores (+13,000), general merchandise stores (+10,000), and non-store retailers (+9,000). Employment in retail trade has risen by 1.9 million since April but is 499,000 below its February level.
- Construction added 84,000 jobs. Specialty trade contractors added jobs, both in the
nonresidential (+28,000) and residential (+18,000) components. Employment also rose in heavy and civil engineering construction and in construction of buildings (+19,000 each). Construction has added 789,000 jobs in the last six months, but employment is down by 294,000 since February.
- Employment in health care and social assistance rose by 79,000 but remains down by 950,000
since February. Health care employment increased by 58,000, with the largest gains occurring in hospitals (+16,000), offices of physicians (+14,000), offices of dentists (+11,000), as well as
outpatient care centers (+10,000). These increases were partially offset by a decline of 9,000 in nursing and residential care facilities. Social assistance added 21,000 jobs over the month.
- Employment in transportation and warehousing increased by 63,000, with gains occurring in warehousing and storage (+28,000), transit and ground passenger transportation (+25,000), as well as truck transportation (+10,000). By contrast, air transportation shed 18,000 jobs. Employment in transportation and warehousing is 271,000 below its February level.
- The other services industry added 47,000 jobs, with gains occurring in personal and laundry services (+27,000) and in repair and maintenance (+18,000). Employment in other services is 436,000 below its February level.
- Manufacturing employment rose by 38,000 but remains 621,000 lower than during February. Gains occurred in fabricated metal products (+7,000), primary metals (+6,000) and wood products (+4,000).
- Employment continued to trend up in food manufacturing (+6,000) and in plastics and rubber products (+4,000).
- Employment in financial activities rose by 31,000 but is 129,000 lower than in February. Over-the-month job gains occurred in finance and insurance (+17,000) and real estate (+10,000).
- Government employment fell by 268,000. A decrease of 138,000 in federal government was driven by a loss of 147,000 temporary 2020 Census workers. Job losses also occurred in local
government education and state government education (-98,000 and -61,000, respectively).
- Employment in other major industries, including mining, wholesale trade and information, changed little month-over-month.
By Geography
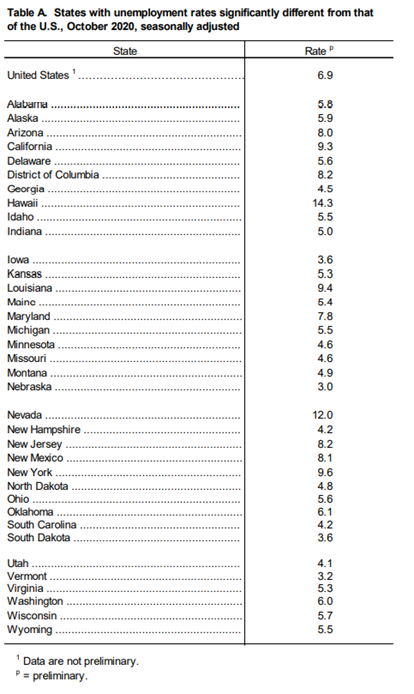
In October, unemployment rates were lower in 37 states and the District of Columbia, higher in eight states and stable in five states, according to the U.S. Bureau of Labor Statistics. (For comparison, last month’s reporting noted unemployment rates were lower during September in 30 states, higher in eight states and stable in 12 states—including the District of Columbia). Forty-seven states and the District had jobless rate increases from a year earlier and three states reported little or no change.
Additionally, nonfarm payroll employment increased in 32 states, decreased in two states and was essentially unchanged in 16 states, including the District of Columbia. Over the year, nonfarm payroll employment decreased in 48 states and the District; it was essentially unchanged in two states.
Hawaii reported the highest unemployment rate at 14.3%, followed by Nevada at 12%.
Nebraska and Vermont boasted the lowest rates at 3% and 3.2%, respectively. In total, 26 states had jobless rates lower than the U.S. figure of 6.9%, while nine states and the District of Columbia posted higher rates. Fifteen states had rates that were not appreciably different from that of the nation.
In October, the largest unemployment rate decreases occurred in Illinois (-3.6 percentage points) and Rhode Island (-3.5 points). Month-over-month, rates declined by at least two percentage points in an additional six states, while the largest jobless rate increase occurred in Kentucky (+1.8 percentage points).
Nonfarm payroll employment increased in 32 states, decreased in two states and was essentially unchanged in 16 states, including the District of Columbia.
The largest job gains occurred in California (+145,500), Texas (+118,100) and Florida (+51,600). The largest percentage increases occurred in Alaska (+2.9%), Hawaii (+2%), as well as Louisiana and Wyoming (+1.2% each). Employment decreased in Wisconsin (-14,700, or -0.5%) and New Hampshire (-3,700, or -0.6%).
Over the year, nonfarm payroll employment decreased in 48 states, including the District of Columbia, and was essentially unchanged in two states. The largest job declines occurred in California (-1,369,400), New York (-1,015,500), and Texas (-499,200). The largest percentage declines occurred in Hawaii (-17.3%), New York (-10.4%) and Vermont (-9.3%).
KPI — November: State of the Manufacturing Sector
Key Performance Indicators Report — November 2020


