KPI — November 2021: State of the Economy

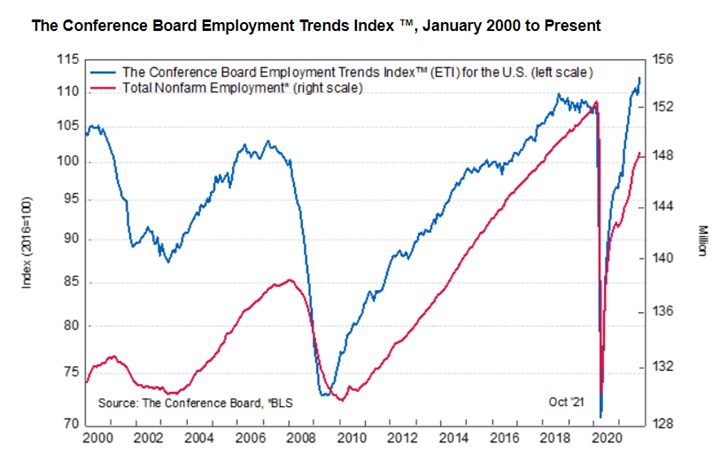
The Conference Board Employment Trends Index™ (ETI) increased sharply in October. The index now stands at 112.23, up from 109.68 in September.
“The increase in the Employment Trends Index suggests strong employment growth is in store over the next several months,” said Gad Levanon, head of The Conference Board Labor Markets Institute. “As the negative economic impact of the Delta variant subsides, spending on – and employment in – in-person services should continue to recover toward pre-pandemic levels. We project the unemployment rate is likely to dip below four percent within the next six months and may reach the pre-pandemic low of 3.5% by the end of 2022. In other words, labor shortages may not go away. In such an environment, significant upward pressure on wages may become the new normal.”
According to The Conference Board, the rapid wage inflation in October suggests that the US labor market is still experiencing severe labor shortages, despite the expiration of the enhanced unemployment benefits and the reopening of schools.
Last month’s record-high job leaver statistics combined with burdensome mandates and the highest inflation in nearly 13 years has some politicians blaming failed economic policy.
Employment
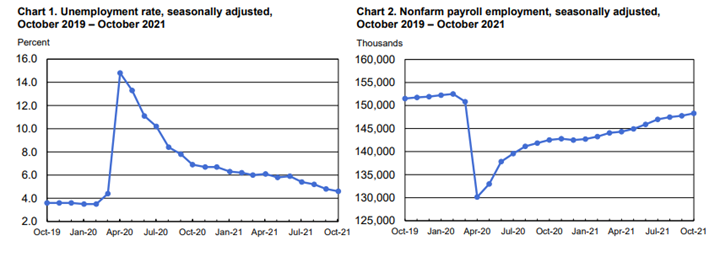
Total nonfarm payroll employment increased by 531,000 in October, compared to a forecast of 450,000. It is the biggest jump in a single month since July. As such, the national unemployment rate was trimmed to 4.6%, according to the Bureau of Labor Statistics.
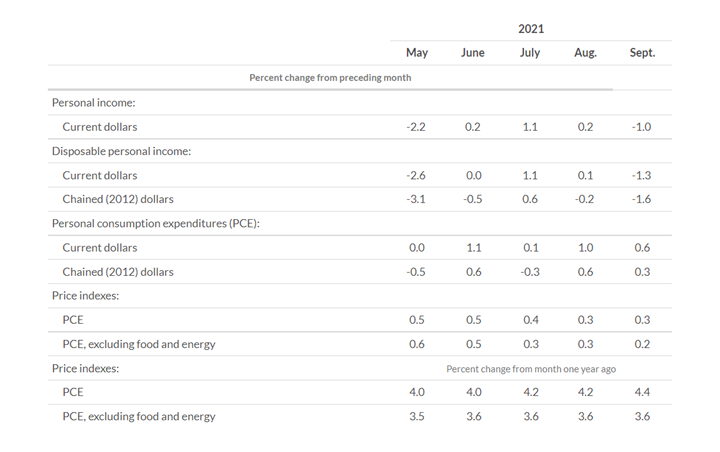
The PCE price index for September increased 4.4% from one year ago, reflecting increases in both goods and services. Energy prices increased 24.9%, while food prices increased 4.1%. Excluding food and energy, the PCE price index for September increased 3.6% from one year ago. According to the U.S. Bureau of Economic Analysis (BEA), the $93.4 billion increase in current dollar PCE in September reflected an increase of $63.6 billion in spending for services and a $29.9 billion increase in spending for goods. Personal outlays increased $92.1 billion, while personal saving was $1.34 trillion and the personal saving rate – personal saving as a percentage of disposable personal income –was 7.5%.
Important Takeaways, Courtesy of the Bureau of Labor Statistics:
- The number of U.S. workers quitting their jobs surged in September, as openings remained near an all-time high. The total number of quits rose by 164,000 in September to a record-high 4.4 million, according to the Labor Department’s Job Opening and Labor Turnover Survey, or JOLTS. This as the number of available positions slipped to 10.4 million but remained near a record high.
- The number of persons on temporary layoff, at 1.1 million, was little changed over the month. This measure is down considerably from the high of 18 million in April 2020 but is 306,000 above the February 2020 level.
- Among the unemployed, the number of permanent job losers, at 2.1 million, changed little in October but is 828,000 higher than in February 2020.
- In October, the number of long-term unemployed (those jobless for 27 weeks or more) decreased by 357,000 to 2.3 million but remains 1.2 million higher than in February 2020. The long-term unemployed accounted for 31.6% of the total unemployed in October.
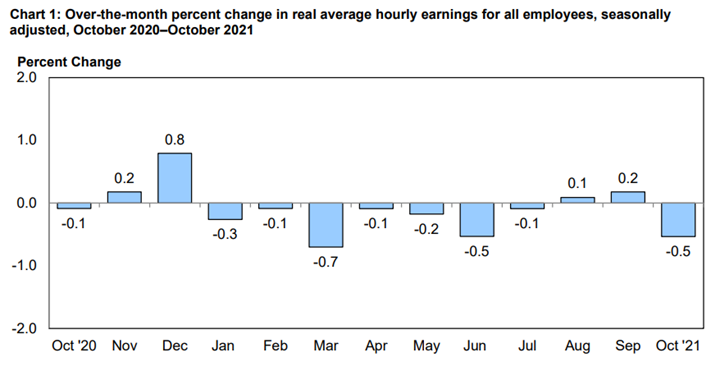
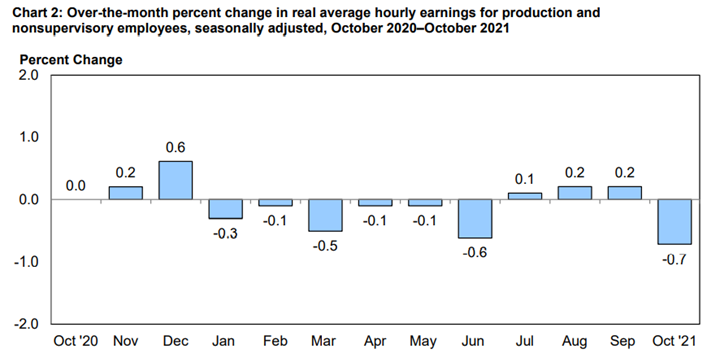
According to the U.S. Bureau of Labor Statistics, real average hourly earnings decreased 1.2%, seasonally adjusted, from October 2020 to October 2021. The change in real average hourly earnings combined with a decrease of .3% in the average workweek resulted in a 1.6% decrease in real average weekly earnings over this period. Real average hourly earnings for production and nonsupervisory employees decreased .7% from September to October, seasonally adjusted. This result stems from a .4% increase in average hourly earnings combined with an increase of 1.1% in the Consumer Price Index for Urban Wage Earners and Clerical Workers (CPI-W). Real average weekly earnings decreased 1% over the month due to the change in real average hourly earnings combined with a decrease of .3% in average weekly hours.
From October 2020 to October 2021, real average hourly earnings decreased 1.1%, seasonally adjusted. The change in real average hourly earnings combined with a .3% decrease in the average workweek resulted in a 1.4% decrease in real average weekly earnings over this period.
By Demographic
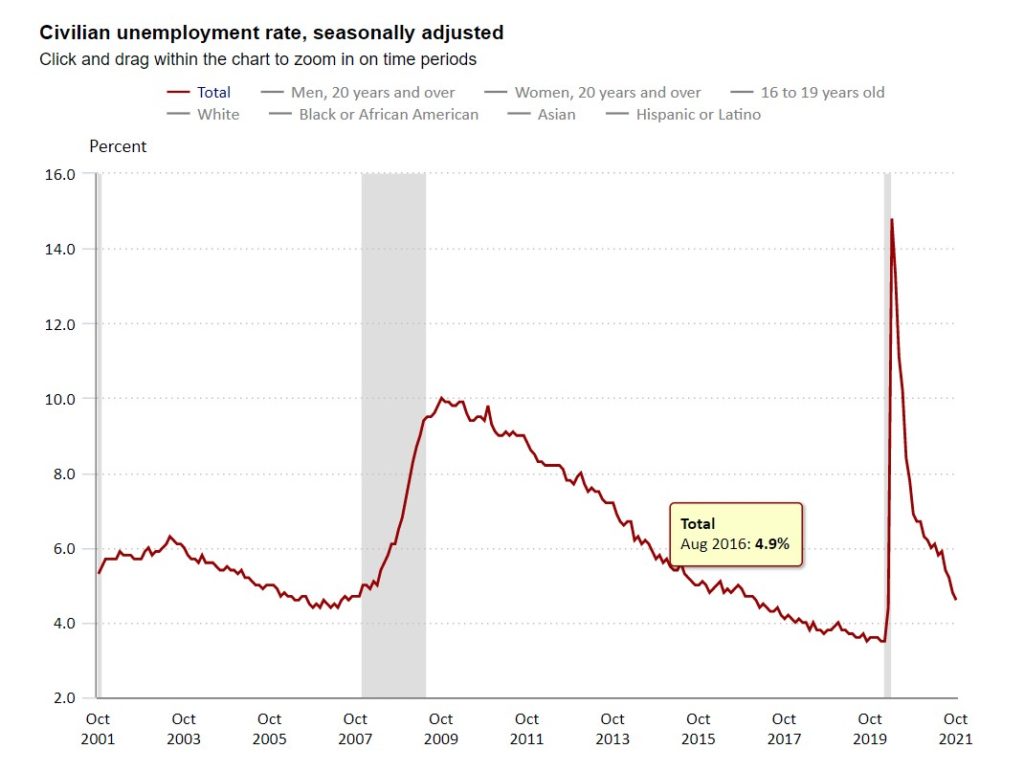
Unemployment rates among the major worker groups: adult men – 4.3%; adult women – 4.4%; teenagers – 11.9%; Whites – 4%; Asians – 4.2%; Hispanics – 5.9%; and Blacks – 7.9%.
By Industry
Nonfarm employment increased by 18.2 million since April 2020 but remains down 4.2 million, or 2.8%, compared to pre-pandemic levels in February 2020.
This month, notable job gains occurred in leisure and hospitality, professional and business services, manufacturing, as well as transportation and warehousing.
Important Takeaways, Courtesy of the U.S. Bureau of Labor Statistics:
- Employment in leisure and hospitality increased by 164,000, up 2.4 million thus far in 2021. Over the month, employment rose by 119,000 in food services and drinking places and by 23,000 in accommodation. Employment in leisure and hospitality remains down by 1.4 million, or 8.2%, since February 2020.
- Professional and business services added 100,000 jobs, including a gain of 41,000 in temporary help services. Employment continued to rise in management and technical consulting services (+14,000), other professional and technical services (+9,000), scientific research and development services (+6,000) and legal services (+5,000). Employment in professional and business services is 215,000 below its pre-pandemic level in February 2020.
- Employment in manufacturing increased by 60,000, led by a gain in motor vehicles and parts (+28,000). Employment also rose in fabricated metal products (+6,000), chemicals (+6,000) and printing and related support activities (+4,000). Manufacturing employment is down by 270,000 since February 2020.
- Employment in transportation and warehousing increased by 54,000 and is 149,000 above its February 2020 level. Job gains occurred in warehousing and storage (+20,000), transit and ground passenger transportation (+16,000), air transportation (+9,000) and truck transportation (+8,000). Employment in couriers and messengers decreased by 5,000, after increasing in the prior three months.
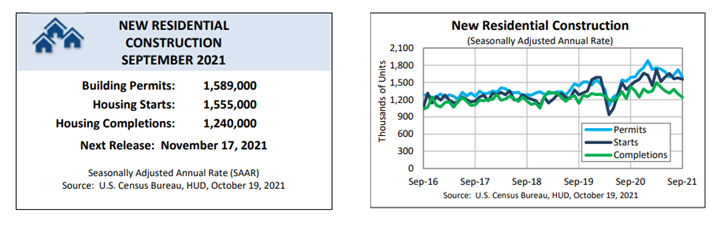
- Construction employment rose by 44,000, following an increase of 30,000 in September. Employment increased in nonresidential specialty trade contractors (+19,000) and in heavy and civil engineering construction (+12,000). Construction employment is 150,000 below its February 2020 level.
Review all employment statistics here.
KPI — November 2021: Consumer Trends
Key Performance Indicators Report — November 2021


