KPI — May 2022: State of the Economy

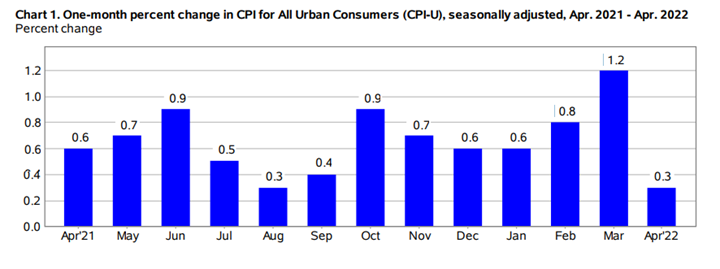
The Consumer Price Index for All Urban Consumers (CPI-U) rose .3% in April on a seasonally adjusted basis, following a 1.2% increase in March. Over the last 12 months, the U.S. Bureau of Labor Statistics reported the all-items index increased 8.3% before seasonal adjustment.
“The biggest attention-getter has been inflation, running at its fastest pace since the early 1980s and helping constrain consumer spending as wage gains haven’t been able to keep up with prices. At the same time, the war in Ukraine has dampened sentiment and added to supply chain issues. And rising interest rates are showing signs of slowing the red-hot housing market,” says journalist Jeff Cox, CNBC.
Increases in the indexes for shelter, food, airline fares and new vehicles were the largest contributors to the seasonally adjusted all-items increase. The food index rose .9% month-over-month, with the food-at-home index rising 1%. The energy index declined in April after rising in recent months. The index for gasoline fell 6.1% month-over-month, offsetting increases in the indexes for natural gas and electricity.
Though gas prices are on the hike again, with the national average $4 or more per gallon. In fact, Morning Consult’s report found consumers are especially worried about rising energy and gas prices, as both continue to put incessant pressure on the overall cost of living.
The index for all-items less food and energy rose .6% in April, following a .3% advance in March. Along with indexes for shelter, airline fares and new vehicles, the indexes for medical care, recreation, as well as household furnishings and operations all increased in April. The indexes for apparel, communication, plus used cars and trucks all declined.
The all items less food and energy index rose 6.2% over the last 12 months. The energy index alone soared 30.3% year-over-year, while the food index increased 9.4% – largest 12-month surge since 1981.
“While bottlenecks have loosened for a handful of product types due to fortified supply chains and cooling goods demand, consumers reported increasing difficulty obtaining products in categories such as grocery, housing-related items and vehicles,” according to Morning Consult’s report. “These categories account for a relatively large share of spending, in turn playing a major role in driving up overall inflation. The impact of the most severely constrained categories overshadows any relief consumers may feel from abating shortages of other product types.”
Employment
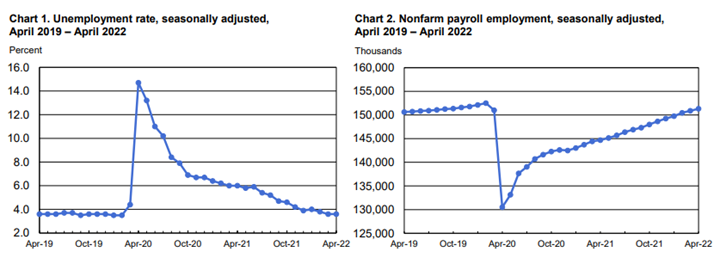
Economic predictions were a wild card this month, ranging from Wilmington Trust’s estimated 350,000 payroll to Jefferies’ projected 1.2 million. In the end, total nonfarm payroll employment landed in the middle – increasing by 428,000 in April, with an unemployment rate unchanged at 3.6%.
Important Takeaways, Courtesy of the Bureau of Labor Statistics:
- The number of people on temporary layoff was little changed at 853,000.
- Among the unemployed, the number of permanent job losers remained at 1.4 million.
- The number of long-term unemployed (those jobless for 27 weeks or more) was little changed at 1.5 million.
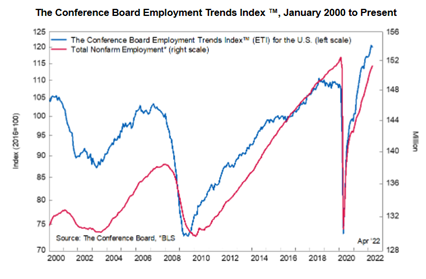
The Conference Board Employment Trends Index™ (ETI) decreased slightly in April to 120.18, down from 120.78 in March 2022 (an upward revision).
By Demographic
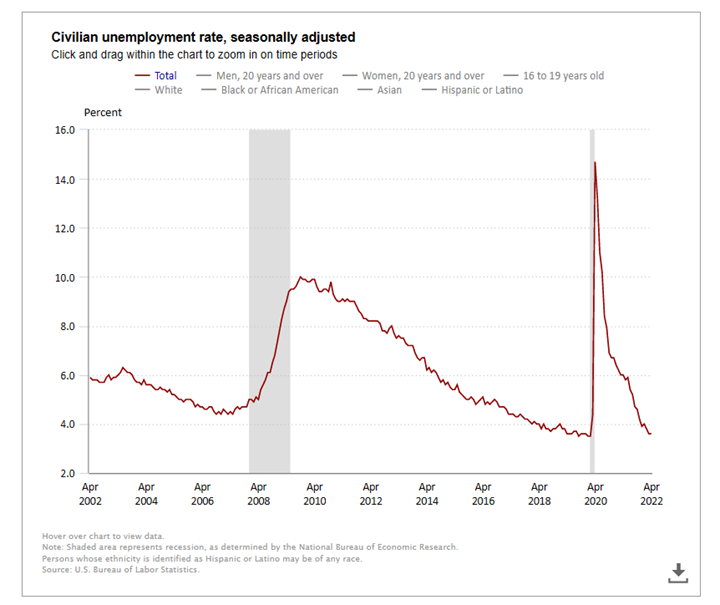
Unemployment rates among the major worker groups: adult women – 3.2%; adult men – 3.5%; teenagers – 10.2%; Asian – 3.1%; White – 3.2%; Hispanic – 4.1% and Black – 5.9%.
By Industry
Total nonfarm payroll employment increased by 428,000 in April, with job notable gains in leisure and hospitality, manufacturing, as well as transportation and warehousing. Despite the bump, nonfarm employment remains down by 1.2 million, or .8%, from its pre-pandemic level in February 2020.
Important takeaways, courtesy of the U.S. Bureau of Labor Statistics:
- Employment in leisure and hospitality increased by 78,000. Job growth continued in food services and drinking places (+44,000) and accommodation (+22,000). Employment in leisure and hospitality is down by 1.4 million, or 8.5%, since February 2020.
- Manufacturing added 55,000 jobs. Employment in durable goods rose by 31,000, with gains in transportation equipment (+14,000) and machinery (+7,000). Nondurable goods added 24,000 jobs, with job growth in food manufacturing (+8,000) and plastics and rubber products (+6,000). Since February 2020, manufacturing employment is down by 56,000, or .4%.
- Employment in transportation and warehousing rose by 52,000. Within the industry, job gains occurred in warehousing and storage (+17,000), couriers and messengers (+15,000), truck transportation (+13,000) and air transportation (+4,000). Employment in transportation and warehousing is 674,000 above its February 2020 level, led by strong growth in warehousing and storage (+467,000) and in couriers and messengers (+259,000).
- Employment in professional and business services is healthy (+41,000). Since February 2020, employment in the industry is up by 738,000.
Review all employment statistics here.
KPI — May 2022: Consumer Trends
Key Performance Indicators Report — May 2022


