KPI — May 2021: State of the Economy

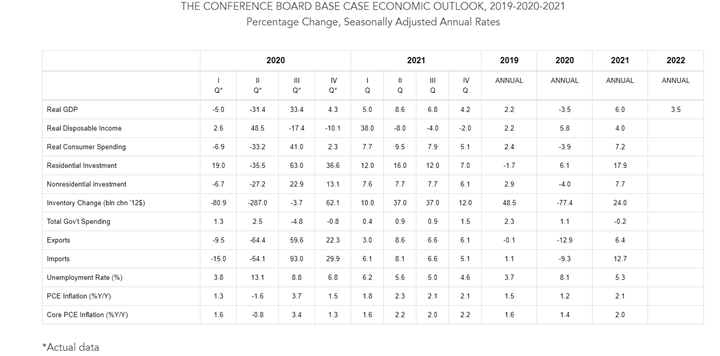
The Conference Board forecasts U.S. real GDP growth at 5% (annualized rate) in Q1 2021* and 6% year-over-year in 2021.*
Economic recovery strengthened during March. “We expect real GDP growth to accelerate further over the coming quarters as new COVID-19 infection rates decline further, the vaccination program continues to expand and a large fiscal support program is fully deployed. Following a robust recovery in 2021, we forecast economic growth of 3.5% year-over-year in 2022,” according to The Conference Board.
All data and analysis are courtesy of The Conference Board.
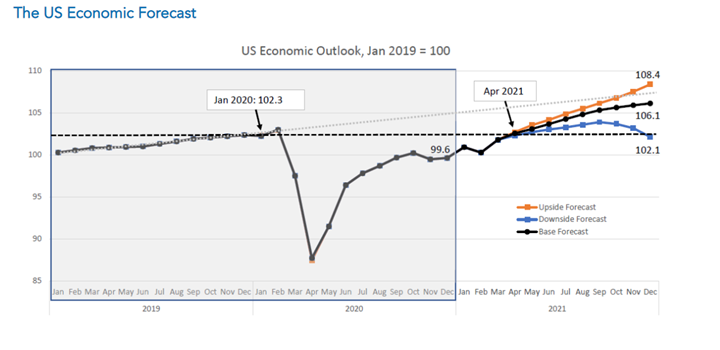
The Conference Board generated three potential recovery scenarios based on specific sets of assumptions:
- Base Forecast: The base forecast yields Q1 2021 real GDP growth of 5% (annualized rate), and an annual expansion of 6% year-over-year in 2021.* The recovery is likely to continue into next year and yield an annual growth rate of 3.5% year-over-year in 2022. Right now, this scenario is the most probable and assumes: a) new cases of COVID-19 peaked in early Q1 2021 and many social distancing restrictions are subsequently retracted in Q2 2021 and Q3 2021; b) COVID-19 vaccinations become broadly available in Q2 2021 and are universally available in early Q3 2021; c) the $1.9 trillion in fiscal support approved in March is deployed in Q2 2021 and Q3 2021; and d) robust improvements in labor markets and consumption in Q2 2021 and Q3 2021. In this scenario, U.S. monthly economic output returns to pre-pandemic levels in April 2021.
- Upside Forecast: A second, more optimistic scenario is the economy grows 6.7% year-over-year in 2021 and assumes: a) new COVID-19 cases fall dramatically over the coming months and all social distancing policies are eliminated in Q2 2021; b) vaccines are universally available by the end of Q2 2021; c) the $1.9 trillion in fiscal support approved in March is deployed in Q2 2021 and Q3 2021; d) the new Administration’s $2.3 trillion infrastructure and tax plan is passed by Q3 2021 and begins to hit the economy before the end of 2021; and e) faster-than-expected improvements occur in labor markets and consumption during Q2 2021. In this scenario, U.S. monthly economic output exceeds the level it may have reached had the pandemic never occurred.
- Downside Forecast: A third, more pessimistic scenario is the U.S. economy grows by just 4.9% year-over-year in 2021 and assumes: a) new cases of COVID-19 rise as vaccine-resistant mutations result in an additional wave in Q4 21; b) distribution of vaccines is prolonged and mutations render them ineffective; c) the Federal Reserve signals that it will begin to raise rates earlier than anticipated; d) unemployment deteriorates and the consumption recovery stagnates; and e) a large correction in equity markets hurts consumer and business confidence. In this scenario, U.S. monthly economic output drops back below pre-pandemic levels by the end of 2021.
Employment
Total nonfarm payroll employment added 266,000 jobs in April, compared to 770,000 in March and 536,000 in February. Coming in well below expectations, April is the weakest month of job growth since January 2021, as reported by NPR.
The national unemployment rate currently stands at 6.1%, slightly higher than last month, according to the U.S. Bureau of Labor Statistics. While unemployment is down considerably from its recent high in April 2020, it remains 3.5 percentage points higher than pre-pandemic levels.
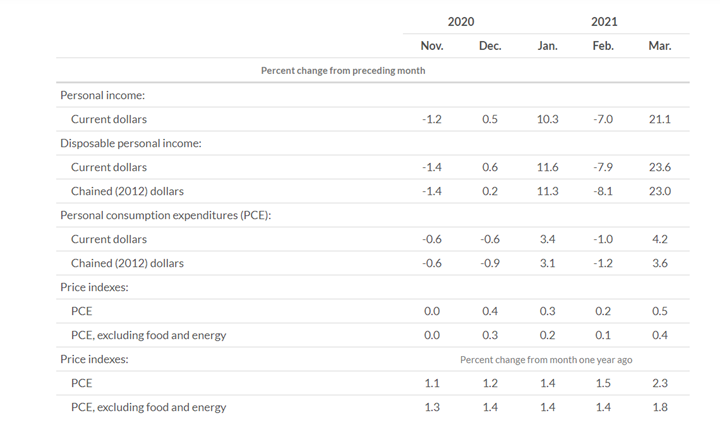
Important to note, the increase in personal income in March largely reflected an increase in government social benefits. Within government social benefits, “other” social benefits increased. The American Rescue Plan Act established an additional round of direct economic impact payments to households.
Important Takeaways, Courtesy of the Bureau of Labor Statistics
- Among the unemployed, the number of persons on temporary layoff is 2.1 million, up slightly from two million a month prior. This measure is down considerably from the recent high of 18 million in April 2020 but remains 1.4 million higher than in February 2020.
- The number of permanent job losers is 3.5 million, up slightly from 3.4 million a month prior. This measure is down considerably from the recent high of 18 million but remains 2.2 million higher than in February 2020.
- Among the long-term unemployed (those jobless for 27 weeks or more), the data remains essentially unchanged month-over-month at 4.2 million. This measure is down considerably from the recent high of 18 million but remains 3.1 million higher than in February 2020. The long-term unemployed accounted for 43% of the total unemployed in April.
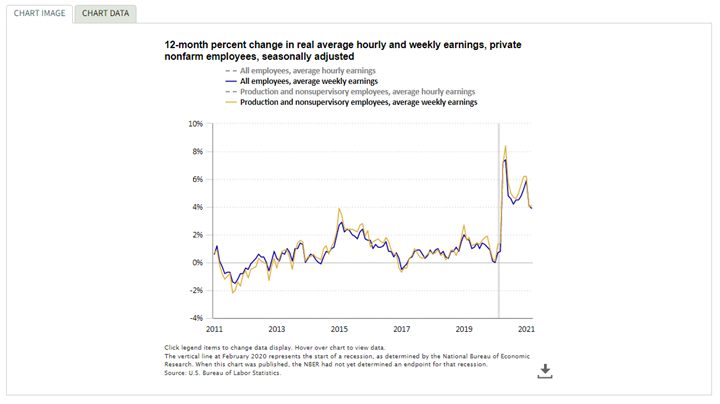
Real average hourly earnings for all private nonfarm employees increased 1.5% from March 2020 to March 2021. The increase in real average hourly earnings combined with a 2.3% increase in the average work week resulted in a 3.9% increase in real average weekly earnings over the year, according to the National Bureau of Economic Research. The large employment fluctuations over the past year – especially in industries with lower-paid workers – complicate the analysis of recent trends in real earnings.
By Demographic
Unemployment rates among all major worker groups in April: *adult men – 6.1%, adult women – 5.6%, teenagers – 12.3%, Whites – 5.3%, Asians – 5.7%, Hispanics – 7.9% and *Blacks – 9.7%.
Unemployment rates among all major worker groups in March: adult men—5.8%, adult women—5.7%, teenagers—13%, Whites—5.4%, Asians—6%, Hispanics—7.9% and Blacks—9.6%.
*Indicates a month-over-month increase.
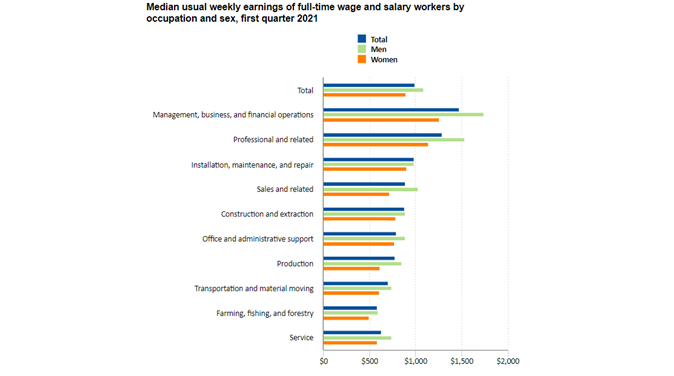
Median weekly earnings of the nation’s 112.1 million full-time wage and salary workers were $989 in the first quarter of 2021, according to the U.S. Bureau of Labor Statistics. Women reported median weekly earnings of $900, or 82.6% of the $1,089 median for men. Full-time workers in management, business and financial operations occupations posted the highest median weekly earnings—$1,741 for men and $1,261 for women. Men and women employed in farming, fishing and forestry jobs had the lowest median weekly earnings in the first quarter of 2021, at $596 and $499, respectively. The ratio of women’s earnings to men’s earnings was highest in installation, maintenance and repair occupations (91.7%).
By Industry
Nonfarm employment is down by 8.2 million in April, or 5.4% compared to pre-pandemic levels in February 2020.
Important to note: The April Employment Situation Summary presents a snapshot of job gains per industry alongside comparison data that illustrates how said job gains stack up against pre-pandemic levels.
April’s increase was driven by the leisure and hospitality industry, which posted 331,000 jobs mostly in food services and drinking places (+187,000). However, overall, the sector still reports 2.8 million fewer jobs than pre-pandemic, indicating the jobs created were not “new” but rather pre-existing positions that had been vacated as a result of COVID restrictions. Small gains were also made in other areas, including repair and maintenance services (+14,000), personal and laundry services (+14,000) and child daycare services (+14,000).
The federal government added 9,000 new jobs over the month as well, though the report fails to compare these numbers to pre-pandemic levels like other categories. Therefore, it is difficult to infer whether or not these positions are brand-new or rehires, or whether they are temporary jobs (i.e., census workers) or pensioned positions (i.e. post office employees).
With total nonfarm payroll employment falling way below leading economists’ forecasts (266,000 vs a predicted one million), such information is necessary for critical analysis. While Treasury Secretary Janet Yellen may say, “One should never take one month’s data as an underlying trend,” economists are significantly less upbeat about the numbers.
But given the robust expectations of over a million jobs gained, “It’s hard to label this anything but a disappointment,” said Joseph Brusuelas, chief economist at the consulting firm RSM.
“The labor market needs to gain 8.2 million jobs to put us back where we were pre-pandemic, not accounting for the jobs that would have been created if the pandemic never happened. Every month job gains don’t accelerate puts us further behind,” explained Nick Bunker, economic research director at Indeed Hiring Lab.
Additionally, some state legislators are taking aggressive measures to combat, what they feel, is the underlying contributor: unprecedented social benefits incentivizing extended unemployment – a position supported by an increase in personal income that points to social benefits as the driver and a rise, albeit small, in national unemployment despite 7.4 million job openings (most recent figure until May 11).
Montana and South Carolina are slated to end federal pandemic employment benefits, stating “enhanced jobless programs are dissuading people from returning to the workforce and are creating labor shortages,” according to CNN.
“The move, which may be replicated in other states as the economy springs back to life amid declining coronavirus cases, is necessary to address Montana’s ‘severe worker shortage,'” said Gov. Greg Gianforte.
Important Takeaways, Courtesy of the U.S. Bureau of Labor Statistics
- Employment in local government education increased by 31,000 but remains 611,000 lower than in February 2020. Federal government employment increased by 9,000 over the month.
- Leisure and hospitality increased by 331,000, as pandemic-related restrictions continued to ease in many parts of the country. More than half of the increase was in food services and drinking places (+187,000). Job gains also occurred in amusements, gambling and recreation (+73,000) and in accommodation (+54,000). Although leisure and hospitality has added 5.4 million jobs over the year, employment in the industry is down by 2.8 million, or 16.8 percent, since February 2020.
- Other services increased by 44,000, with gains in repair and maintenance (+14,000) and personal and laundry services (+14,000). Employment in other services is 352,000 below its February 2020 level.
- Social assistance rose by 23,000, with about half of the increase in child day care services (+12,000). Employment in social assistance is 286,000 lower than in February 2020.
- Financial activities rose by 19,000 over the month, with most of the gain occurring in real estate and rental and leasing (+17,000). Employment in financial activities is down by 63,000 since February 2020.
- Within professional and business services, employment in temporary help services declined by 111,000 in April and is 296,000 lower than in February 2020. Business support services lost jobs in April (-15,000), while architectural and engineering services and scientific research and development services added jobs (+12,000 and +7,000, respectively).
- Within transportation and warehousing, employment in couriers and messengers fell by 77,000 in April but is up by 126,000 since February 2020. Air transportation added 7,000 jobs over the month.
- Manufacturing employment edged down in April (-18,000), following gains in the previous 2 months (+54,000 in March and +35,000 in February). In April, job losses in motor vehicles and parts (-27,000) and in wood products (-7,000) more than offset job gains in miscellaneous durable goods manufacturing (+13,000) and chemicals (+4,000). Employment in manufacturing is 515,000 lower than in February 2020.
- Retail trade employment changed little in April (-15,000), following a gain in the prior month (+33,000). In April, employment declined in food and beverage stores (-49,000), general merchandise stores (-10,000), and gasoline stations (-9,000). These losses were partially offset by employment increases in sporting goods, hobby, book, and music stores (+20,000); clothing and clothing accessories stores (+10,000); and health and personal care stores (+9,000). Employment in retail trade overall is 400,000 lower than in February 2020.
- Employment in construction was unchanged over the month. Employment in the industry is up by 917,000 over the year but is 196,000 below its February 2020 level.
KPI — May 2021: Consumer Trends
Key Performance Indicators Report — May 2021