- KPI – March 2026: State of Business – Automotive Industry
- KPI – March 2026: State of Manufacturing
- KPI – March 2026: State of the Economy
- KPI – March 2026: Consumer Trends
- KPI – March 2026: Recent Vehicle Recalls
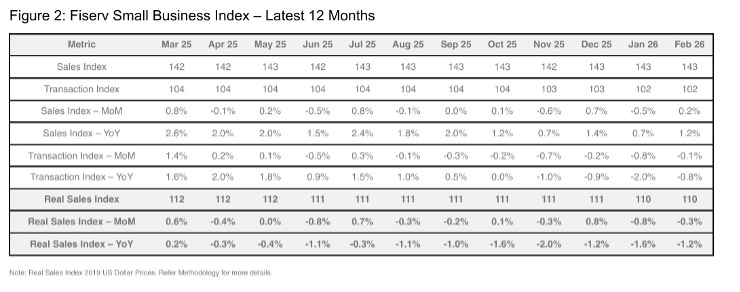
In February, the national Fiserv Small Business Index held at 143.0, reflecting year-over-year and month-over-month growth of 1.2% and 0.2%, respectively. The Fiserv Small Business Transaction Index reached 101.9, posting a year-over-year decline of 0.8% and a slight month-over-month decrease of 0.1%. Data shows overall results indicate steady sales growth despite a slight drop in transaction activity.
Key Takeaways, Courtesy of The Fiserv Small Business Sales Index:
- February sales accelerated by 1.2% year-over-year, despite transactions slowing 0.8%. Month-over-month sales were up 0.2%, while foot traffic changed little since January. Ongoing recovery from a massive winter event toward the end of January, combined with another strong East Coast weather system in late February, served to reset demand priorities across small business. Average tickets grew 2% year-over-year and increased 0.3% during January.
- Key subsectors with a year-over-year sales boost in the wake of harsh weather events included Repair and Maintenance (up 1.5%), Health and Personal Care Retailers (up 3%) and Accommodations (Hotels), which gained 4.3%, likely due to stranded passengers and displaced residents as weather interrupted travel and power generation across much of the U.S. Overall, Professional Services sales grew 4.2% year-over-year, as pricing for Tax Preparation, Business Services, Legal Services and similar are as much as 8% higher.
- Retail was up slightly at 0.6% year-over-year, with no acceleration month-over-month. Consumers seem to be recalibrating, with foot traffic falling 0.2% from January but rising 1.4% year-over-year. Food and Beverage Stores (up 0.8%), Motor Vehicle Parts (up 0.9%) and Health and Personal Care Retailers (up 0.5%) had small but meaningful gains month-over-month, likely in direct response to weather-related pressures; however, year-over-year sales growth tells a different story. Food & Beverage Stores declined 0.1% despite foot traffic growth of 0.5%, as consumers traded down on average tickets by choosing budget-friendlier items.
- Food Services and Drinking Places (Restaurants) sales were flat but up nominally year-over-year, showing some de-prioritization by consumers. Foot traffic trends were down 0.4% month-over-month and 2.1% year-over-year, further reinforcing this message. The lackluster sales performance is due to Limited-Service Restaurants. The category was down 0.6% month-over-month and 1.8% year-over-year, where eroding foot traffic of 0.6% month-over-month and 3.5% year-over-year continues. Full-Service Restaurants performed much better, up 0.5% month-over-month and 1.4% year-over-year, driven by both transaction growth and average ticket growth.
Despite facing extraordinary economic pressure, the small business sector continues to showcase resilience. At 98.8, the NFIB Small Business Optimism Index fell 0.5 points but remained slightly above the 52-year average of 98. The Uncertainty Index decreased three points from January to 88.
“Although optimism declined slightly, small businesses report feeling more certain in February as they look toward the coming months,” says Bill Dunkelberg, NFIB chief economist. “High sales and increased profits made February a more positive month for many owners, but competition from large businesses is putting stress on Main Street firms as they navigate the current economic climate.”
Important Takeaways, Courtesy of NFIB:
- The Employment Index ticked up nearly a point to 103.5—3.5 points above its historical average of 100 and 2.3 points above its 2025 average. This gain was driven primarily by its compensation-related components rather than employee-count related ones.
- 15% of small business owners cited labor quality as their single most important problem, down one point from January and the fourth consecutive monthly decline. The last time labor quality was this low was in April 2020.
- A net 1% of all owners (seasonally adjusted) reported higher nominal sales in the past three months, up seven points from January. The percent reporting actual sales gains are now close to the historical average of a net 0%. The last time actual sales were this high was in May 2022.
- The net percent of owners expecting higher real sales volumes fell eight points from January to a net 8% (seasonally adjusted). This more than erased the strong, six-point gain observed in January.
- In February, 59% of small business owners reported that supply chain disruptions affected their business to some extent, a decrease of three points from January.
- The net percent of owners raising average selling prices fell two points from January to a net 24% (seasonally adjusted). This marked the third consecutive month that actual price increases slowed, though the changes remain well above the historical average.
- Seasonally adjusted, a net 34% reported raising compensation, up two points from January and the highest level since March 2025.
- The frequency of reports of positive profit trends rose seven points from January to a net negative 14% (seasonally adjusted). The last time earnings trends were this high was in December 2021.
- When asked to evaluate the overall health of their business, 12% rated it as excellent (down two points), 55% as good (up one point), 26% as fair (down one point) and 5% as poor (up one point).
- Eight percent reported competition from large businesses as their single most important problem, up two points from January. The last time competition from large businesses was this high was in May 2021.
Professionals in the automotive, RV and powersports industries remain steadfast in their efforts to evolve their business models and grow their brands in the face of adversity. As such, the monthly Key Performance Indicator Report serves as an objective wellness check on the overall health of our nation, from the state of manufacturing and vehicle sales to current economic conditions and consumer trends. Below are a few key data points explained in further detail throughout the report.
Key Data Points:
- Economic activity in the manufacturing sector expanded for the second straight month. The Manufacturing PMI registered 52.4% in February, a 0.2-percentage point decrease compared to the reading of 52.6 in January. The overall economy continued to expand for the 16th month.
- In February, the Global Light Vehicle (LV) selling rate improved modestly to 86.6 million units per year, following a weak start to 2026. The market declined 8.5% year-over-year due to a sharp contraction in the Chinese PV market for the second consecutive month; sales totaled six million units globally.
- Total new-vehicle sales for March 2026, including retail and non-retail transactions, are projected to reach 1,372,877, a 11.4% decrease year-over-year and a 11.9% increase from February 2026, according to a joint forecast from JD Power and GlobalData.
- Powersports Business says dealers across the country reported an incline of 1% in combined same-store sales compared to the same month last year, according to composite data from more than 1,700 dealerships in the U.S. that utilize CDK Lightspeed DMS. On average, dealerships were up 0.7% in major units, 1.1% in parts and 2.5% in service.
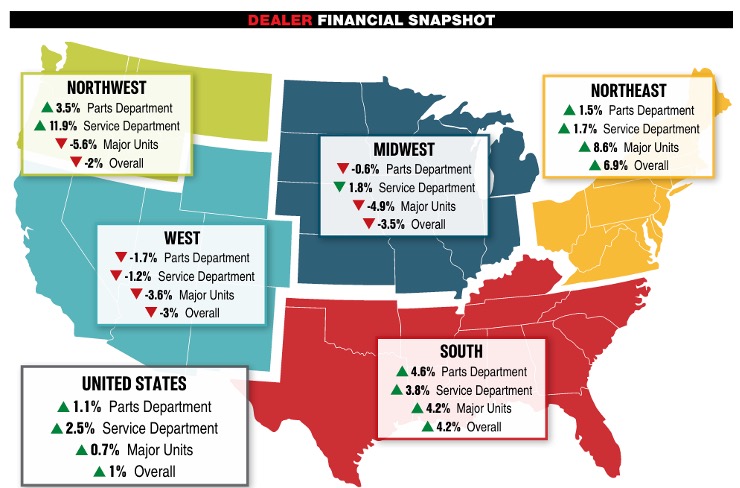
Image Source: Powersports Business