KPI — June: Voice of Consumers

Below is a synopsis of relevant consumer-level details, including personal and disposable income, retail impact, consumer confidence and overall consumer sentiment.
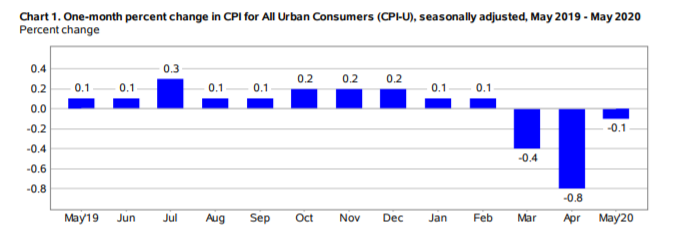
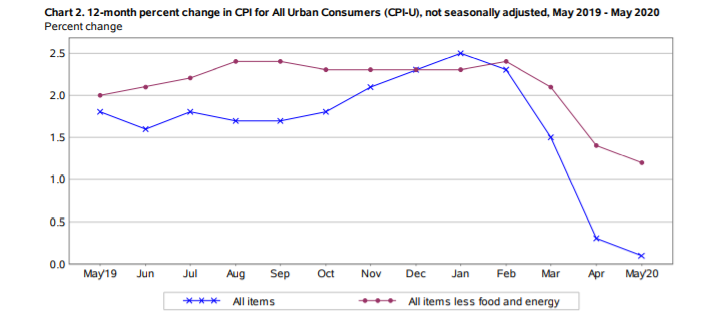
After dropping 0.8% in April, the Consumer Price Index for All Urban Consumers (CPI-U) declined 0.1% on a seasonally adjusted basis the following month. The all items index increased 0.1% over the last 12 months (before seasonal adjustment), according to the U.S. Bureau of Labor Statistics.
Important takeaways from current reporting include the following, courtesy of the Bureau:
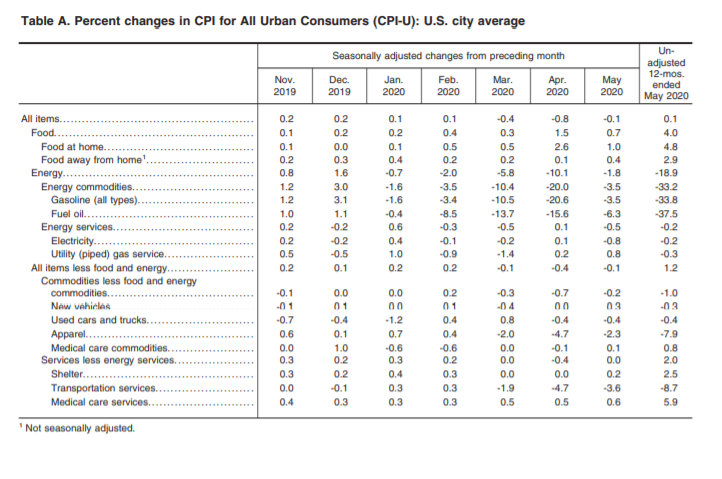
- Declines in the indexes for motor vehicle insurance, energy and apparel more than offset increases in food and shelter indexes to result in the monthly decrease in the seasonally adjusted all items index.
- The gasoline index declined 3.5% in May, leading to a 1.8% decline in the energy index.
- In contrast, the food index increased 0.7% in May as the index for food at home rose 1%.
- Along with motor vehicle insurance and apparel, the indexes for airline fares and used cars and trucks declined in May. The indexes for shelter, recreation, medical care, household furnishings and operations, as well as new vehicles all increased.
- The index for all items less food and energy fell 0.1% in May, its third consecutive monthly decline and the first time this index has ever declined in three consecutive months.
- The all items index increased 0.1% for the 12 months ending May. The index for all items less food and energy increased 1.2% over the last 12 months; this compares to a 2.4% increase a few months ago (the period ending February). The energy index fell 18.9% over the last year. The food index increased 4% over the last 12 months, with the index for food at home rising 4.8%.
Income, Consumer Spending and Retail Sales
Local economies are reopening across the U.S., though consumer sentiment remains mixed as many Americans express heightened uncertainty about the months to come. In truth, a dichotomy exists between an improvement in the data versus the reality of impact that many, if not most, Americans are actually experiencing across the country. For example, while total nonfarm payroll employment rose by 2.5 million in May and the unemployment rate dropped, the fact remains 13.3% of Americans are currently jobless—and that number would be exponentially higher if not for the federal PPP program.
Furthermore, while recent reporting by the Bureau of Economic Analysis indicates a personal income increase of $1.97 trillion (10.5%) and a disposable personal income (DPI) increase of $2.13 trillion (12.9%), personal consumption expenditures (PCE)—that is, consumer spending—actually showed a decrease of $1.89 trillion (13.6%).
In reality, the perceived increase in personal income directly reflects an increase in government social benefits, as payments were made to individuals from federal economic recovery programs in response to the COVID-19 pandemic, according to the Bureau of Economic Analysis. Likewise, the $1,662.1 billion decrease in real PCE during the reporting period reflects a $758.3 billion decrease in spending for goods and a $943.3 billion decrease in spending for services.
These examples are not pointed out to undermine the significant efforts and rebounds in recovery post pandemic. On the contrary, they serve as a reminder of vigilance in data consumption and analysis because although the U.S. has taken extraordinary efforts to resume normalcy, no set of data can wholly encapsulate and quantify feelings of uncertainty.
The esteemed 20th-century economist Frank Knight once observed that there is a critical distinction between “risk,” which can be quantified and thus managed, and “uncertainty,” which by contrast refers to an event whose probability cannot be known and therefore cannot be readily managed. Therefore, according to Knight, risk applies to situations where we do not know the outcome but can accurately measure the odds. Uncertainty, on the other hand, applies when we do not know all the information needed to set accurate odds in the first place. So, a known risk is “easily converted into an effective certainty,” while “true uncertainty,” as Knight called it, is “not susceptible to measurement.” –National Retail Federation
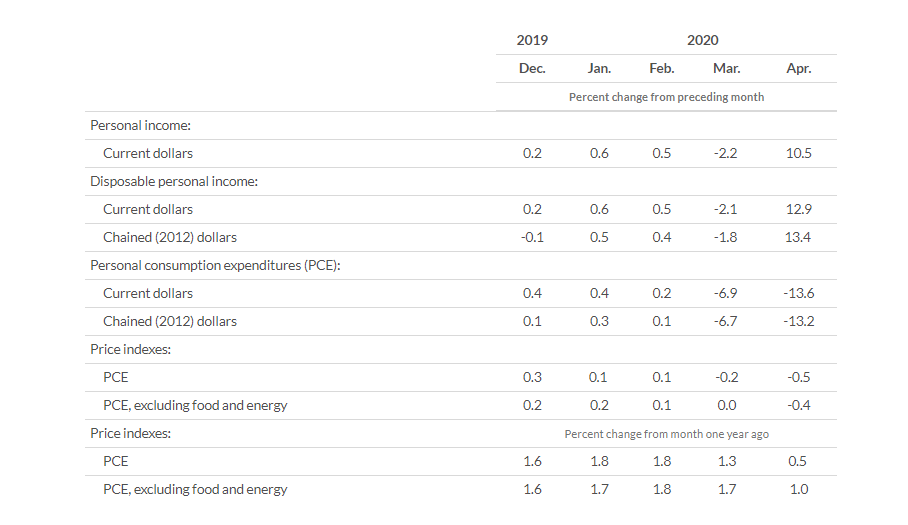
Personal outlays decreased $1.91 trillion in April (table 3). Personal saving was $6.15 trillion in April and the personal saving rate—personal saving as a percentage of disposable personal income—was 33.0 percent (table 1).
However, since consumer spending accounts for approximately 68% of GDP, perhaps it is the most realistic measure of economic health. Consumer spending data for the month of May was unavailable at the time of writing, but one can deduce an increase in the numbers, as retail sales spiked 17.7% during the same timeframe.
Advance estimates of U.S. retail and food services sales for May 2020, adjusted for seasonal variation and holiday and trading-day differences, but not for price changes, were $485.5 billion, an increase of 17.7% (± 0.5%) from the previous month, but 6.1% (± 0.7%) below May 2019. Total sales for the March 2020 through May 2020 period were down 10.5% (± 0.5%) from the same period a year ago. The March 2020 to April 2020 percent change was revised from down 16.4% (±0.5%) to down 14.7% (± 0.2%). Retail trade sales were up 16.8% (± 0.5%) from April 2020, but 1.4% (± 0.7%) below last year. Nonstore retailers were up 30.8% (± 1.4%) from May 2019, while building material and garden equipment and supplies dealers were up 16.4% (± 1.9%) from last year. – The U.S. Census Bureau
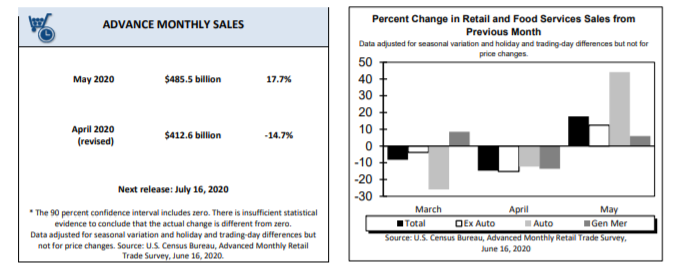
The U.S. Census Bureau announced the following advance estimates of U.S. retail and food services sales for May 2020.
During a live interview on CNBC’s Squawk Box program, NRF President and CEO Matthew Shay was quoted as saying the sales report is very encouraging. “For a sick economy, there is no better medicine than retailers responding to consumers who are ready to safely return to stores. These sales numbers do not reflect the same strength we had going into the pandemic, but they certainly reflect the trajectory we need coming out of it. The most important thing now is to keep these retail stores open for business and not penalize them by closing their doors in the event of a coronavirus surge. As those stores that remained open—our economic first responders—have shown, retailers have developed solutions that protect the safety of their customers and associates, and they are sharing those lessons to the benefit of store owners large and small in communities across the country,” said Shay.
According to National Retail Federation®, every category of retail saw month-over-month gains, with some of them dramatic, especially among retailers that had been mostly closed the month before. Clothing stores were up an astonishing 188%, while furniture stores were up 89.7% and sporting goods stores were up 88.2%. But year-over-year gains online and at retailers that had remained open such as grocery stores and drug stores were largely offset by drops in other categories.
NRF Chief Economist Jack Kleinhenz provides Americans with the stark reminder that full recovery is a long way off. “Comparisons against April have to be taken in context because April was a full month when almost everything that wasn’t deemed ‘essential’ was shut down. Spending has improved considerably but it’s still far below where it was a year ago, and while the freefall in consumer confidence is over, unemployment remains high and confidence is still at recession levels,” he explained.
“Going forward, wallets are primed, increased foot traffic shows that consumers are returning to stores and retailers are ready to meet their demand, but we are likely to remain on a roller coaster for a while,” added Kleinhenz. “What we need to look at is the trajectory of employment and the direction of the virus. There’s hope for a turnaround in the economy in the third quarter but if the virus has a reawakening, we’re going to see some serious situations for consumers.”
Consumer Sentiment
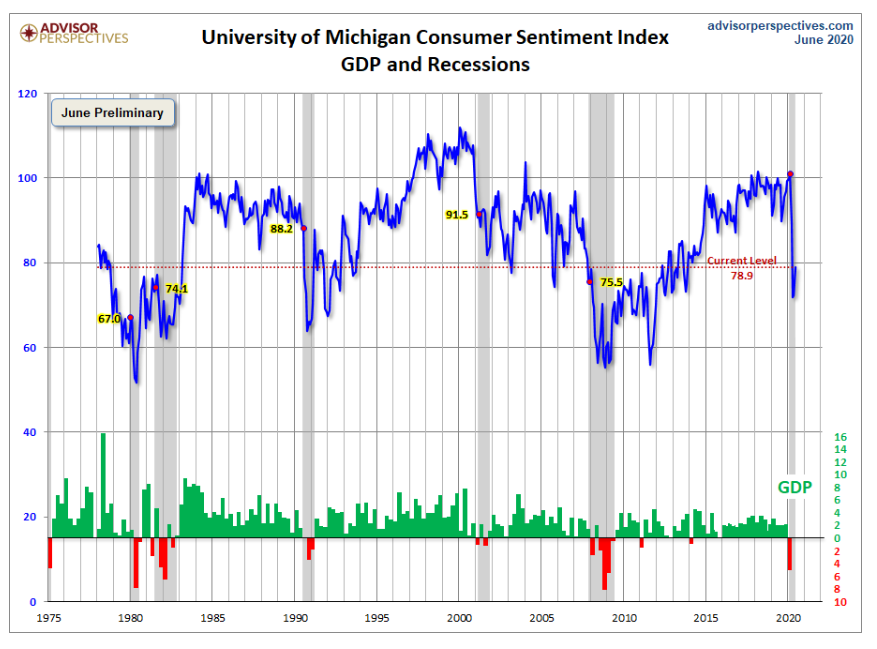
Preliminary consumer sentiment data for June registered at 78.9, above the forecast of 75.0.
Consumer sentiment posted its second monthly gain in early June, paced by gains in the outlook for personal finances and more favorable prospects for the national economy due to the reopening of the economy. The turnaround is largely due to renewed gains in employment, with more consumers expecting declines in the jobless rate than at any other time in the long history of the Michigan surveys. Despite the expected economic gains, few consumers anticipate the reestablishment of favorable economic conditions anytime soon. Bad times financially in the economy as a whole during the year ahead were still expected by two-thirds of all consumers, and a renewed downturn was anticipated by nearly half over the longer term. The most often cited cause of a renewed downturn is a resurgence in the spread of the coronavirus, and the most often cited cause of a slow economic recovery is the financial damage from persistently high unemployment. Each of these factors have increased the uncertainty consumers now attach to their expectations. The resulting record level of income uncertainty has had a significant impact on consumers’ willingness to make discretionary purchases, although uncertainty has slightly eased recently (see the chart). Importantly, these concerns have also been mitigated by deep discounts on prices and interest rates. NBER’s cyclical peak in February and recession call was no surprise to consumers: during the past three months 89% to 95% have judged the economy in decline, up from the recent low of 24% in January of 2020. –Richard Curtin, chief economist for Surveys of Consumers
Jill Mislinski of Advisor Perspectives, a leading interactive publisher for Registered Investment Advisors (RIAs), wealth managers and financial advisors, puts the report into a larger historical context. “Since its beginning in 1978, consumer sentiment is 8.6% below the average reading (arithmetic mean) and 15.3% below the geometric mean. The current index level is at the 29th percentile of the 510 monthly data points in this series,” she explained. The following charts and analysis are courtesy of Advisor Perspectives.
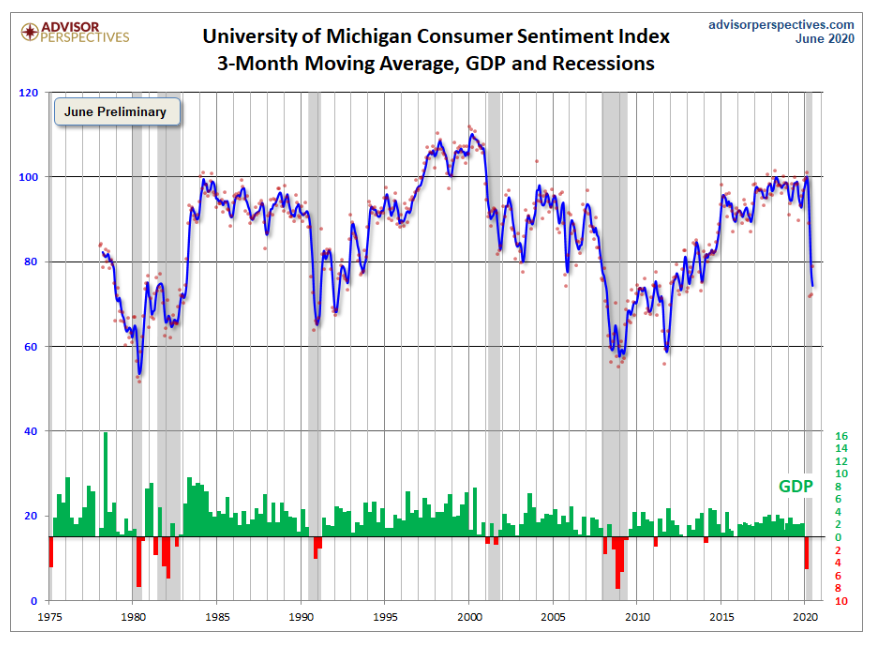
Note this indicator is somewhat volatile, with a 3.0 point absolute average monthly change. The latest data point saw a 6.6-point increase from the previous month. For a visual sense of the volatility, another chart is side-by-side, this time with the monthly data and a three-month moving average.
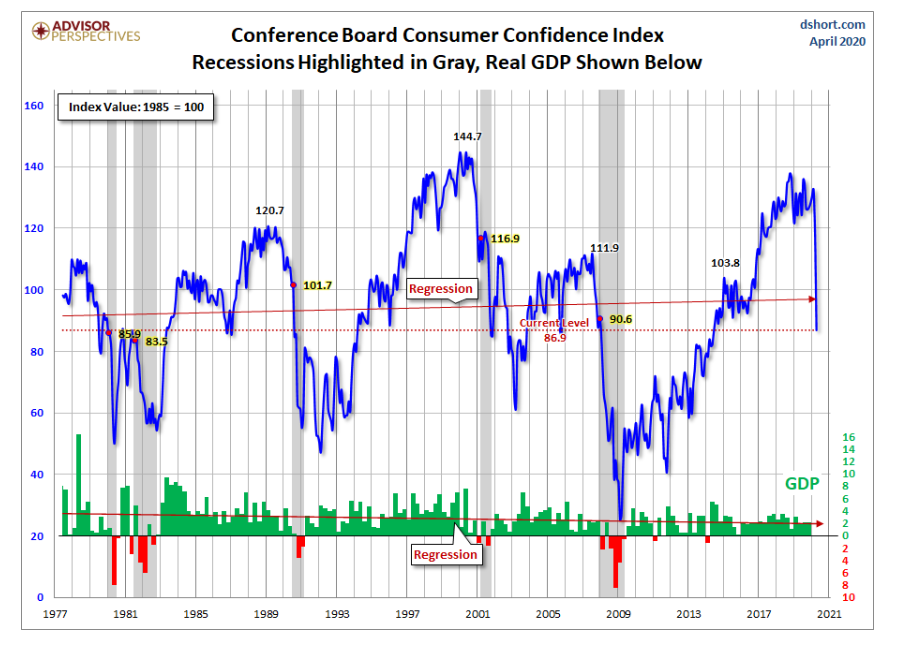
For the sake of comparison, here is a chart of the Conference Board’s Consumer Confidence Index. The Conference Board Index is the more volatile of the two, but the broad pattern and general trends have been remarkably similar to the Michigan Index.