KPI — June: New and Used Vehicle Sales
New Vehicle Sales
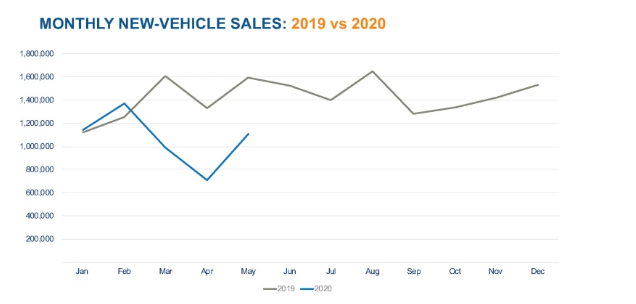
Last month vehicle sales topped at 1,110,609, a 30.2% year-over-year decrease and the worst May on record since the Great Recession. The seasonally adjusted annual rate (SAAR) of sales during the reporting period was 12.2 million, a disappointing decrease from 17.4 million a year prior, but J.D. Power points to positive signs in recent weekly trends—observing resumption in retail sales after a three-week pause in recovery.
Note: There is a discrepancy in U.S. vehicles sales data, with Cox Automotive and Kelley Blue Book reporting 1,110,609, a 30.2% year-over-year decrease. J.D. Power states 1,129,000 units were sold, a decline of just over 28%, with retail sales (-17%) outperforming fleet sales (-72%).
“For the week ending June 1, retail sales were 12% below the pre-virus forecast, a significant improvement relative to the performances observed over the previous three weeks and the strongest on record since the COVID crisis began. A significant increase in the sales pace occurred in the final days of May, which was driven by dealers and consumers taking advantage of elevated incentive programs, such as 0% for 84-month financing,” explained J.D. Power.
Hitting the million mark in May is not only a 57% improvement in comparison to April 2020, but also symbolically laying a foundation of hope as the industry prepares for long-term economic recovery. “The million-plus sales in May demonstrate that as markets reopen and dealerships learn to manage sales while following social-distancing rules, demand will return,” added Cox Automotive.
Important takeaways, courtesy of Cox Automotive:
• Total year-to-date sales in the U.S. through the end of May 2020 stood at 5.32 million vehicles, down approximately 23% versus the same period last year. Even if sales move back to normal in the second half of the year—an unlikely scenario considering our current economic conditions—sales in 2020 still finish down double-digits versus 2019.
• In addition to high unemployment and low consumer confidence, available inventory will likely become an issue holding back auto sales this summer. At the start of June, the available number of new vehicles for sale in the U.S. stood at 2.7 million, according to a Cox Automotive analysis of vAuto data. That is the lowest inventory volume in the past 18 months. And even though vehicle assembly plants are beginning to reopen across North America, full inventory availability is likely still months away.
Important takeaways, courtesy of J.D. Power:
• Sales performance across the country remains mixed, but a majority of markets advanced during week ending June 1. As a result, 173 out of 210 markets exhibited positive sales momentum last month, while five markets including Tampa, Houston, Denver, Pittsburgh and West Palm Beach beat the pre-virus forecast for the period.
• After three-weeks of declines, average transaction prices rose slightly in the final week of May to $34,400. The increase was driven by a higher premium nameplate mix overcoming downward pricing pressure from the normalization of pickup segment share. Ultimately, prices are normalizing as pickup mix falls back and smaller SUVs gain market share.
• Transaction prices reached their highest-level on record at $35,700 during the week ending April 5, and then declined. After three-weeks of declines, average transaction prices rose slightly in the final week of May to $34,400. The increase was driven by a higher premium nameplate mix overcoming downward pricing pressure from the normalization of pickup segment share. Ultimately, prices are normalizing as pickup mix falls back and smaller SUVs gain market share.
• The virus is projected to remove 1,200,000 to 1,600,000 sales over the five months of March through July 2020. Full-year sales will be determined primarily by the extent to which normal business and social activities can resume, mitigation of economic conditions through government stimulus actions, inventory constraints and OEM incentives. The full-year retail sales outlook is 11,300,000 to 12,300,000 sales versus a pre-virus baseline of 13.4 million sales, while the 2020 full-year outlook for total sales is now forecast to be 12,900,000 to 14,200,000 versus a pre-virus baseline of 16,800,000.
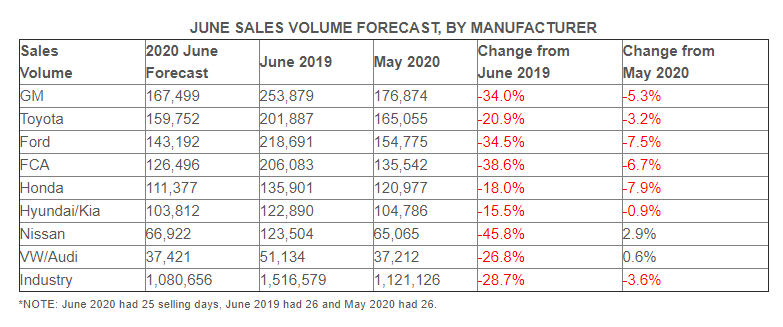
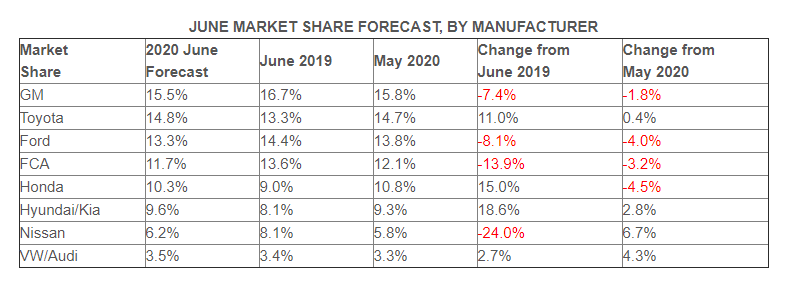
As we round the corner on the final days of June, experts at Edmunds forecast 1,080,656 new cars and trucks sold across the U.S., for an estimated seasonally adjusted annual rate (SAAR) of 12.8 million. This reflects a 28.7% decrease in sales from June 2019 and a 3.6% decrease from May 2020, according to Edmunds data.
The Ford F150 has dropped to third place in new vehicle registrations in the U.S., surpassed by the Chevrolet Silverado 1500 and Toyota RAV4. Additionally, new vehicle registrations for crossovers continue to increase over prior time periods, and dominate with over half of all new vehicle registrations. –Experian Automotive, Quarterly Report
Used Vehicle Sales
Unlike new vehicle retail sales, the used vehicle market continues to flex its resiliency. Per J.D. Power’s Power Information Network (PIN) data, used retail prices at the end of May were down just 2.3 percentage points versus the beginning of March and continue to exhibit great stability. The month of May closed with the relationship between used retail and wholesale auction prices back to pre-virus levels.
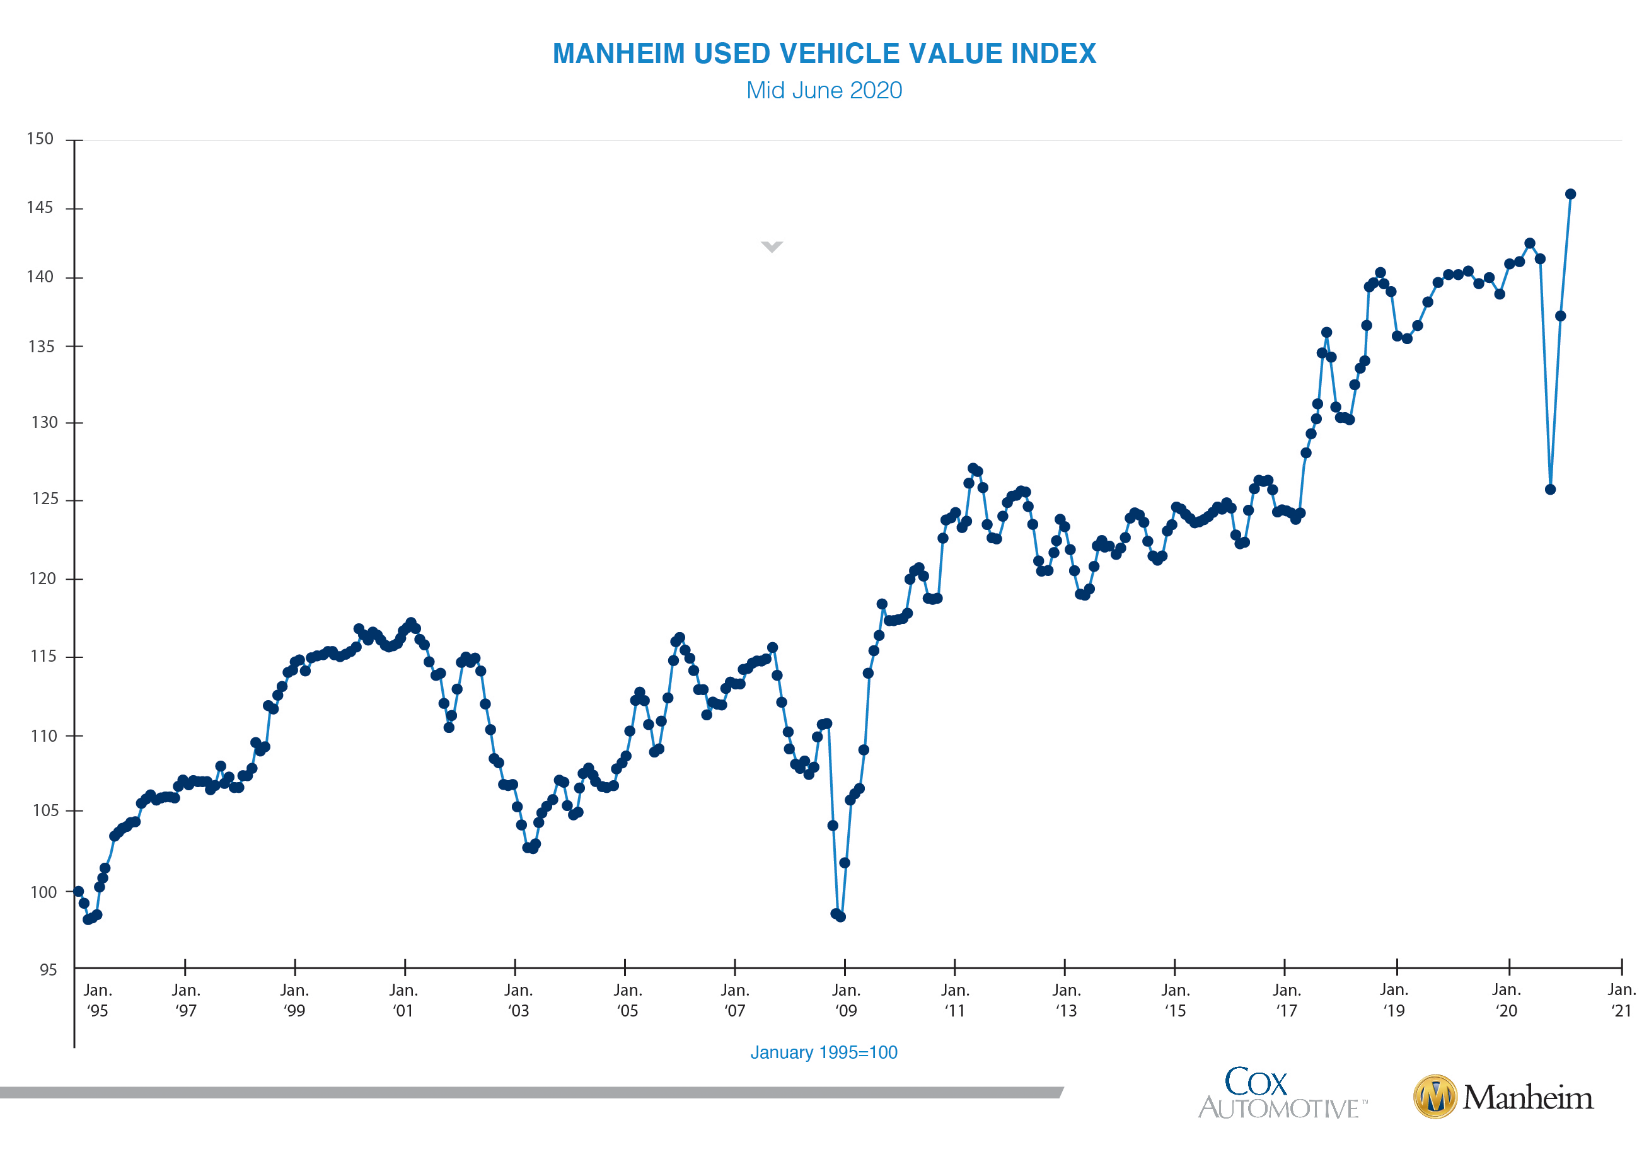
Wholesale used vehicle prices (on a mix-, mileage- and seasonally adjusted basis) received a bump of 6.6% in the first 15 days of June compared to May. This brings the mid-month Manheim Used Vehicle Value Index to 146.1, a 4% increase from June 2019. In fact, if the mid-month value of the Manheim Index holds for the full month, the Index will hit an all-time high—ironically during a pandemic.
Manheim Market Report (MMR) prices have improved as well in recent weeks, resulting in a 3.7% cumulative increase in the first two weeks of June on the Three-Year-Old Index. “Over the first 15 days of June, MMR Retention, which is the average difference in price relative to current MMR, was above 100% every day and averaged 102.8%. The MMR Retention trend reflected that vehicles were selling above current MMR values. The weekly price performance in May and June has been more reminiscent of a typical March and April,” the company stated.
At a macro-level, J.D. Power predicts the year will close with prices down 2% to 4% on a full-year basis versus 2019, which is an improvement over the previous post-virus forecast of 3% to 5% down. “Looking back, our pre-virus forecast had prices flat-to-up slightly this year. While the used market undoubtedly faces challenges, we should not discount its upside potential,” stated J.D. Power.


