KPI — July: State of the Manufacturing Sector

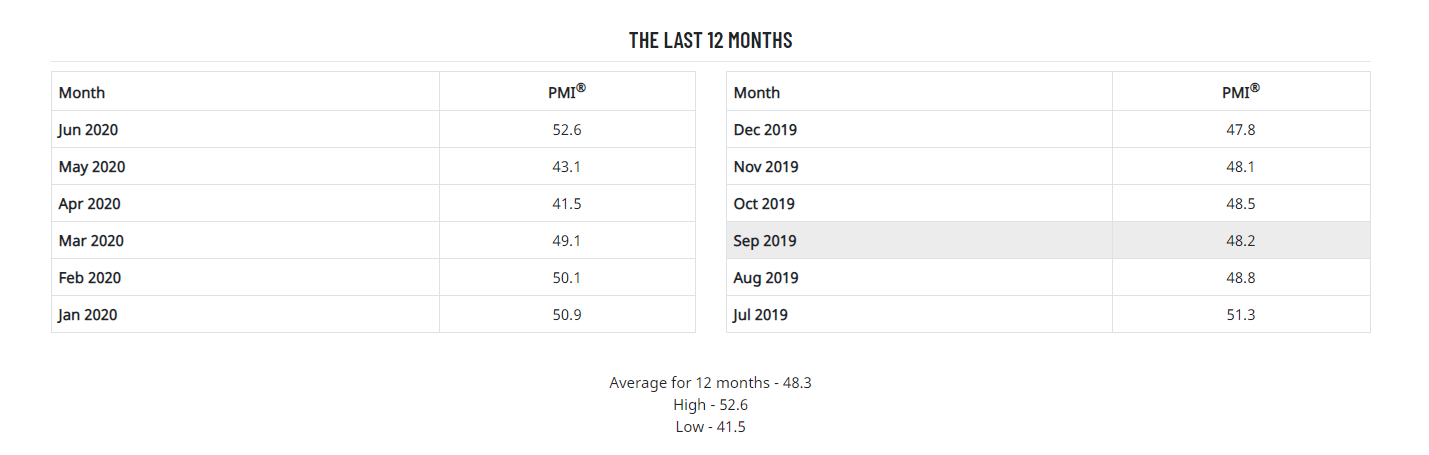
Economic activity in the manufacturing sector grew in June, with the overall economy achieving a second month of growth after one month of contraction, according to the nation’s supply executives in the latest Manufacturing ISM® Report On Business®. The June PMI® registered 52.6%, up 9.5 percentage points from a May reading of 43.1%.
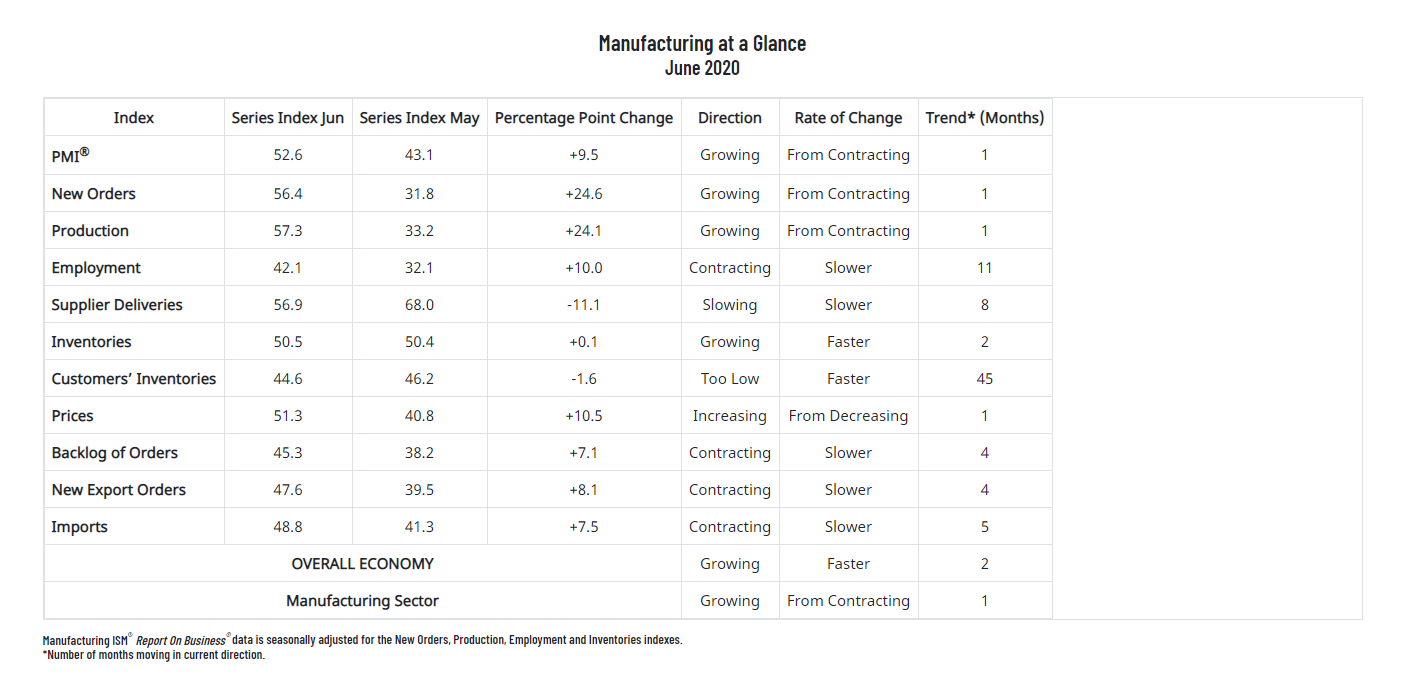 The Report On Business® measures its data using the Purchasing Manager’s Index (PMI), which is an indicator of economic health in the manufacturing sector. A reading above 50% indicates that the manufacturing economy is generally expanding, while below 50% indicates that it is generally contracting. All data and analysis are courtesy of Institute for Supply Management.
“June signifies manufacturing entering an expected expansion cycle after the disruption caused by the coronavirus (COVID-19) pandemic. Comments from the panel were positive (1.3 positive comments for every one cautious comment), reversing the cautious trend which began in March,” said Timothy R. Fiore, CPSM, C.P.M., Chair of the Institute for Supply Management® (ISM®) Manufacturing Business Survey Committee. “The manufacturing sector is reversing the heavy contraction of April, with the PMI® increasing month-over-month at a rate not seen since August 1980, with several other indexes also posting gains not seen in modern times,” he continued.
“Demand, consumption and inputs are reaching parity and are positioned for a demand-driven expansion cycle as we enter the second half of the year. Among the six biggest industry sectors, Food, Beverage & Tobacco Products remains the best performing industry sector. Computer & Electronic Products and Chemical Products returned to respectable growth. Transportation Equipment and Fabricated Metal Products continue to contract, but at much softer levels,” explained Fiore.
• Demand expanded, with the (1) New Orders Index growing at a respectable level, supported by New Export Orders Index contraction softening; (2) Customers’ Inventories Index returning to a level considered a positive for future production, and (3) Backlog of Orders Index softening, although still contracting.
• Consumption (measured by the Production and Employment indexes) contributed positively (a combined 34.1-percentage point increase) to the PMI® calculation, with most companies’ employees returning to work in June.
• Inputs—expressed as supplier deliveries, inventories and imports—weakened, due to supplier delivery issues abating and import levels improving. Inventory levels reached parity with supply and demand. Inputs contributed negatively (a combined 11-percentage point decrease) to the PMI® calculation but were more than offset by the demand and consumption improvement.
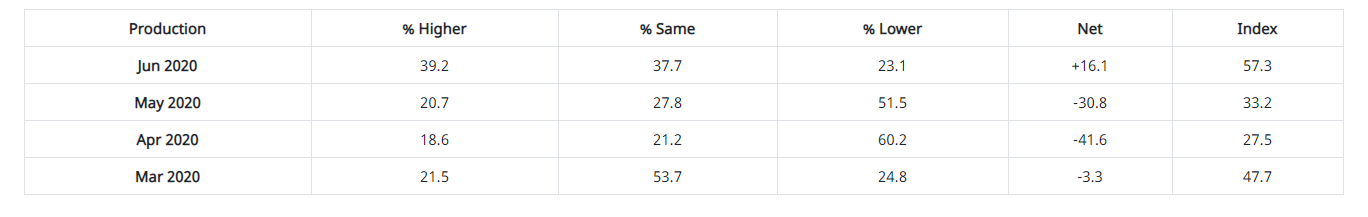
The Production Index registered 57.3% in June, indicating that production grew after contracting for three straight months. The increase of 24.1 percentage points is the largest since August 1952, when the index increased 46.8 percentage points.
“Four of the top six industries expanded strongly, with two contracting softly, a marked improvement from May,” said Fiore.
*An index above 51.7%, over time, is generally consistent with an increase in the Federal Reserve Board’s Industrial Production figures.
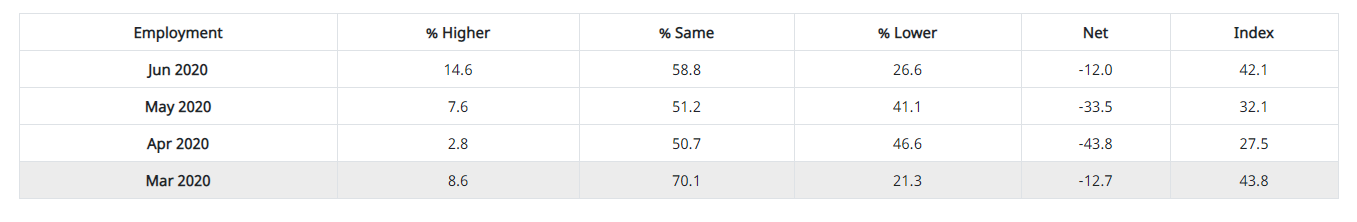
ISM®’s Employment Index registered 42.1% in June, which is 10 percentage points higher than a May reading of 32.1%. This is the index’s largest month-over-month increase since April 1961 (11 percentage points).
“This is the 11th consecutive month of employment contraction, but at a slower rate compared to May. Three of the six big industry sectors experienced expansion, as stay-at-home orders were lifted and more people returned to work. Long-term labor market growth remains uncertain, but moderately strong new order levels and a softening of backlog contraction were encouraging signs,” explained Fiore.
*An Employment Index above 50.8%, over time, is generally consistent with an increase in the Bureau of Labor Statistics (BLS) data on manufacturing employment.
Of the 18 manufacturing industries, five reported employment growth in June: Apparel, Leather & Allied Products; Nonmetallic Mineral Products; Computer & Electronic Products; Food, Beverage & Tobacco Products; and Chemical Products. Eleven industries reported a decrease in employment, including Printing & Related Support Activities; Petroleum & Coal Products; Transportation Equipment; Primary Metals; Electrical Equipment, Appliances & Components; Plastics & Rubber Products; Paper Products; Furniture & Related Products; Fabricated Metal Products; Machinery; and Miscellaneous Manufacturing.
• Commodities Up in Price: Aluminum*; Caustic Soda; Copper; Crude Oil (2); Diesel Fuel*; Ethanol; Natural Gas; Personal Protective Equipment (PPE)—Masks (3); Steel—Hot Rolled; Steel—Scrap; and Steel Products*.
• Commodities Down in Price: Aluminum* (5); Diesel Fuel* (4); Methanol (2); Nylon (2); Packaging Materials (2); Plastic Products (2); Resins; Solvents (2); and Steel Products* (3).
• Commodities in Short Supply: Ethanol; PPE (2); Sanitizers & Disinfectants; and PPE—Gloves (4).
Note: The number of consecutive months the commodity is listed is indicated after each item. *Indicates both up and down in price.
What Respondents Are Saying
• “While we are seeing signs of an uptick in business activity, it is a slow recovery at this point.” (Chemical Products)
• “Gradually ramping production back in our plants. Most of our supply base continued to operate during COVID-19, so we are not seeing a significant supply risk. Will be monitoring supply chain financial health closely.” (Transportation Equipment)
• “Thankfully, we are in quite a few industries, so impact wasn’t as harsh on us and more stable. However, during the last two weeks, our bookings have grown and supply seems to be more readily available.” (Fabricated Metal Products)
• “Difficulty keeping up with a significant increase in demand related to COVID-19. Industry is up 62.5% versus [a] year ago. Supply challenges throughout the supply chain. Supply could be hindered if another wave of COVID-19 hits in the fall.” (Food, Beverage & Tobacco Products)
• “Market demand for refined products has increased as statewide quarantines have been lifted, but it is still below normal volumes.” (Petroleum & Coal Products)
• “Orders have picked up and are trending toward normal production requirements [volume similar to 2019 production].” (Plastics & Rubber Products)
• “We are seeing an increase in orders as the economy starts to get rolling again. Slow and steady, sales are increasing. So far, so good.” (Primary Metals)
• “Looks like May was the bottom in terms of orders. June is stronger, and our order books are rebuilding.” (Machinery)
• “Demand is down significantly due to COVID-19 but is starting to stabilize. We are hopeful for recovery in the second half of the year.” (Miscellaneous Manufacturing)
• “The building industry continues to defy expectations, as we continue to rebound stronger from the previous month. Being an essential business across most states and a surge in DIY projects has fueled the industry forward. While the industry will follow the greater economy, we do believe it will be more resilient than most due to potential migration from larger cities and an undersupplied housing market.” (Wood Products)
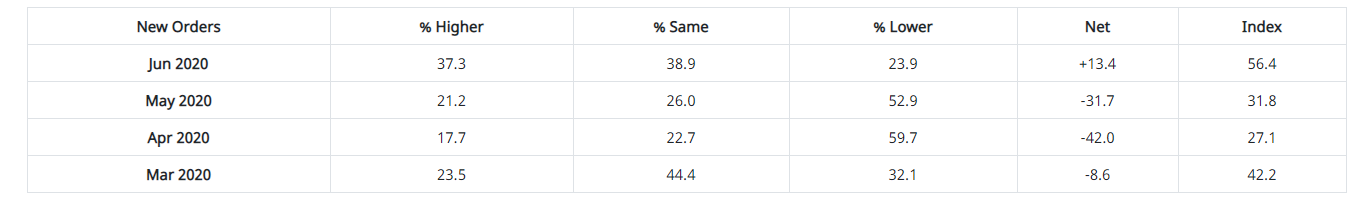
ISM®’s New Orders Index registered 56.4% in June, an increase of 24.6 percentage points compared to the 31.8% reported in May. This is the index’s largest month-over-month increase since records began in January 1948.
“Of the top six industry sectors, Food, Beverage & Tobacco Products and Chemical Products expanded strongly. Transportation Equipment and Fabricated Metal Products remained in contraction, but at much softer levels. Demand improved in June across all six big industry sectors,” said Fiore.
*A New Orders Index above 52.5%, over time, is generally consistent with an increase in the Census Bureau’s series on manufacturing orders (in constant 2000 dollars).
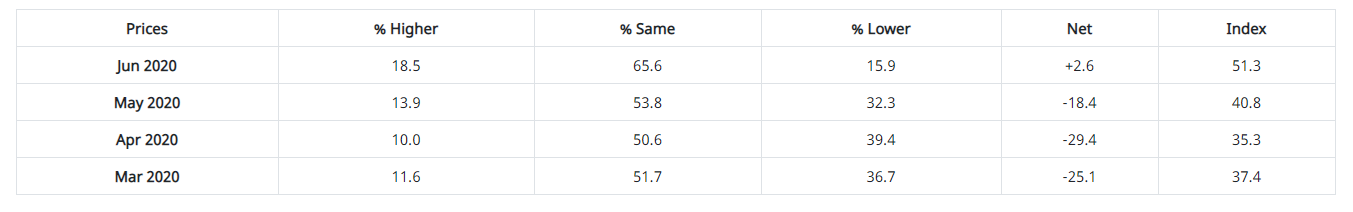
The ISM® Prices Index registered 51.3%, which is 10.5 percentage points higher than a May reading of 40.8%, indicating raw materials prices increased after four consecutive months of declines.
“Prices increased in June, driven primarily by alcohols and other chemicals, steels, steel scrap, aluminum, copper, personal protective equipment and energy. The return of price growth indicates that supplier/buyer pricing power is closer to parity,” said Fiore.
*A Prices Index above 52.5%, over time, is generally consistent with an increase in the Bureau of Labor Statistics (BLS) Producer Price Index for Intermediate Materials.
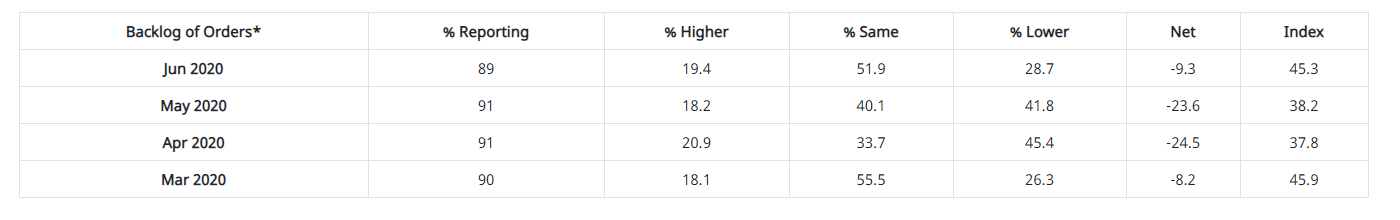
ISM®’s Backlog of Orders Index registered 45.3% in June, a 7.1-percentage point increase compared to 38.2% reported in May, indicating order backlogs contracted for the fourth consecutive month.
“A slowing of backlog contraction is a positive for the future. It indicates that production satisfied most new-order intake and consumed a lower amount of backlog while customer inventories declined. Panelists also indicated that the period of order-book adjustment is ending. Two of the six big industry sectors’ backlogs expanded, a marked improvement from May,” said Fiore.
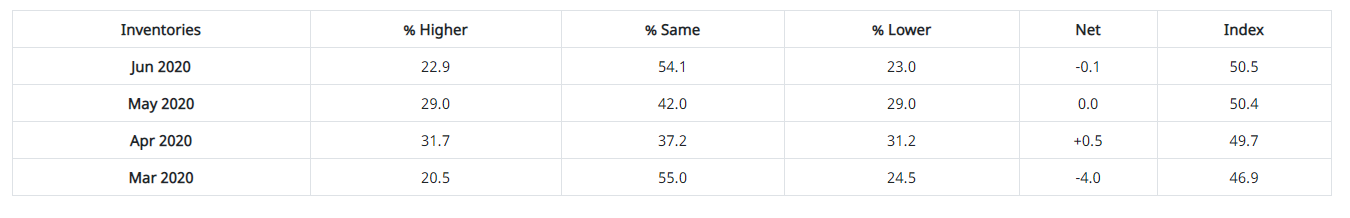
The Inventories Index registered 50.5% in June, 0.1 percentage point higher than the 50.4% reported for May.
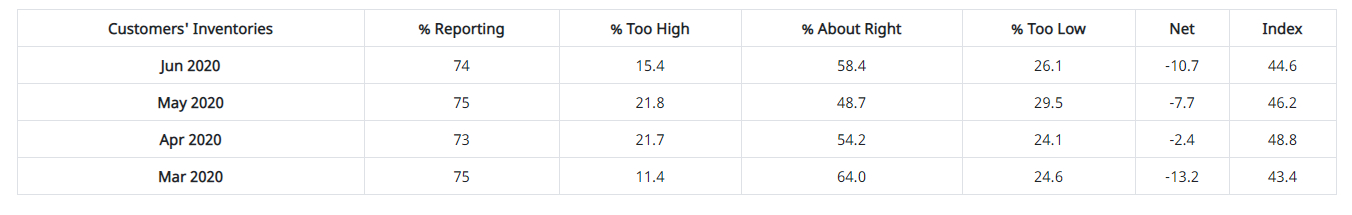
ISM®’s Customers’ Inventories Index registered 44.6% in June, 1.6 percentage points lower than the 46.2% reported for May, indicating that customers’ inventory levels were considered too low.
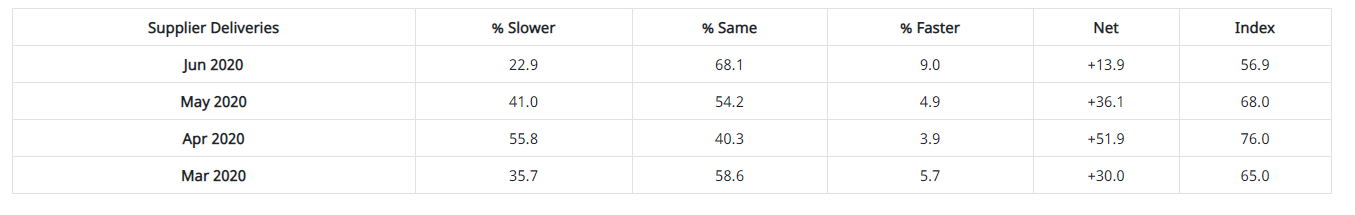
The delivery performance of suppliers to manufacturing organizations was slower in June, as the Supplier Deliveries Index registered 56.9%. This is 11.1 percentage points lower than the 68% reported in May. That percentage-point decrease is the index’s largest month-over-month decline since a drop of 11.9 percentage points in May 1979.
“Suppliers continue to struggle to deliver, although at a slower rate compared to May. Plant shutdowns, transportation challenges and continuing difficulties in importing parts and components continue to be factors, but to lesser degrees. The Supplier Delivery Index currently reflects a healthy supply/demand balance,” said Fiore.
*A reading below 50% indicates faster deliveries, while a reading above 50% indicates slower deliveries.
New Export Orders*
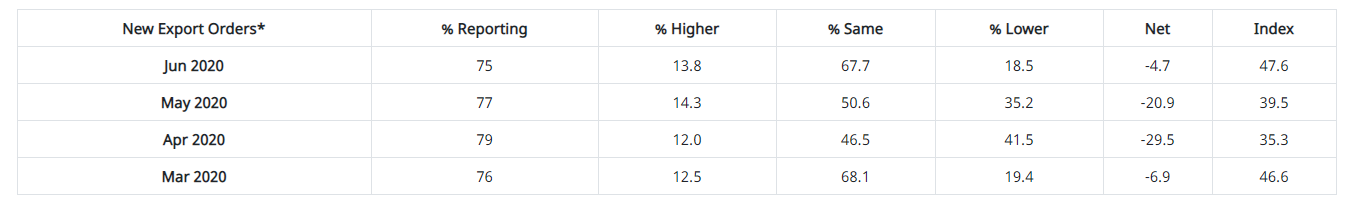
ISM®’s New Export Orders Index registered 47.6% in June, up 8.1 percentage points compared to a May reading of 39.5%. Three industries reported growth in new export orders during June, including Textile Mills; Paper Products; and Plastics & Rubber Products. Conversely, nine industries reported a decrease in new export orders: Nonmetallic Mineral Products; Printing & Related Support Activities; Electrical Equipment, Appliances & Components; Primary Metals; Fabricated Metal Products; Computer & Electronic Products; Transportation Equipment; Food, Beverage & Tobacco Products; and Chemical Products. Six industries reported no change in new export orders in June compared to May.
Imports*
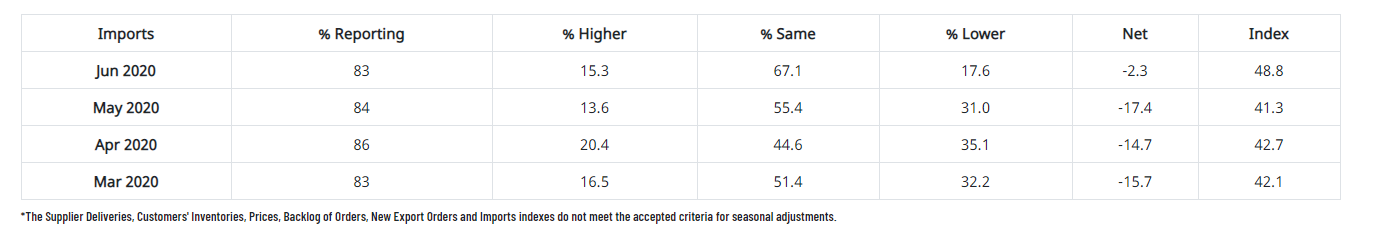
ISM®’s Imports Index registered 48.8% in June, up 7.5 percentage points compared to the 41.3% reported in May.
“For the fifth consecutive month, imports were in contraction territory, but at significantly slower rates, reflecting increased U.S. demand. However, panelists noted continuing difficulty in obtaining import materials, primarily from China,” added Fiore.
Five industries reported growth in imports during June: Apparel, Leather & Allied Products; Wood Products; Printing & Related Support Activities; Machinery; and Food, Beverage & Tobacco Products. Eight industries reported a decrease in imports: Nonmetallic Mineral Products; Plastics & Rubber Products; Primary Metals; Miscellaneous Manufacturing; Electrical Equipment, Appliances & Components; Transportation Equipment; Fabricated Metal Products; and Computer & Electronic Products.