KPI — July: State of the Economy

Recently, the National Bureau of Economic Research (NBER) declared an official U.S. economic recession. Though May and June data was promising, as a result of stay-at-home directives being eased and local economies starting to resume business, increased instances of COVID-19 outbreaks across the U.S. threaten to delay further reopening and may even result in new lockdown mandates.
“Presently, under our baseline scenario, we do not expect a large second wave of cases to sweep the country in the autumn, but do expect weak consumer demand due to persistently high unemployment and the expiration of various government stimulus programs,” stated The Conference Board.
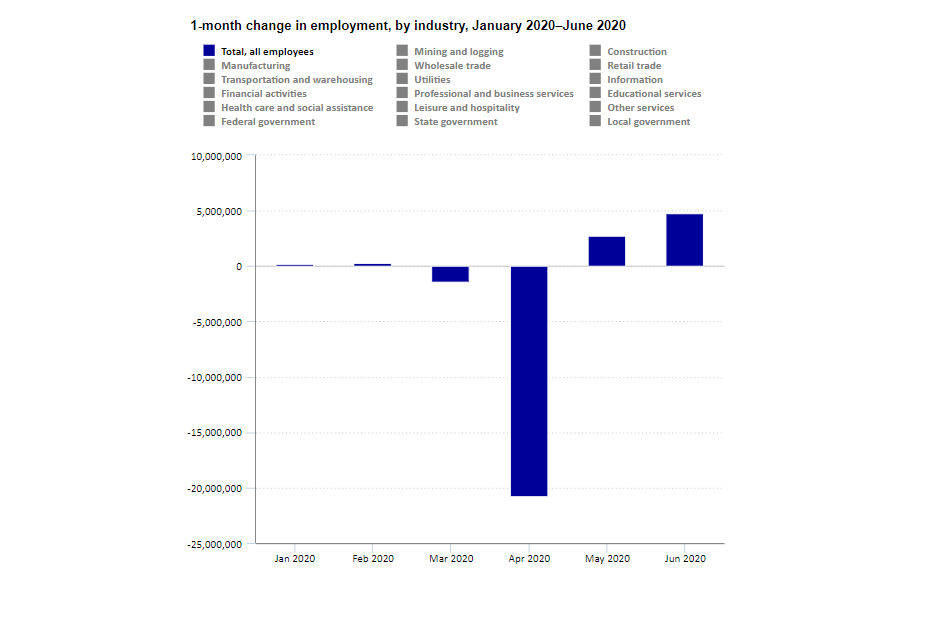
That said, Americans remain hopeful after receiving a positive jobs report for June. Total nonfarm payroll employment posted an increase of 4.8 million following a 2.7 million uptick the month prior, according to the U.S. Bureau of Labor Statistics. As such, the unemployment rate declined by 2.2 percentage points to 11.1%, while the number of unemployed persons fell by 3.2 million to 17.8 million.
“Today’s jobs report shows that our resilient economy continues to return more people to work, more quickly, than forecast. It is heartening to see employment gains across nearly all demographics. The report reflects that we can return millions more Americans to work in the weeks ahead, provided we bear in mind that economic recovery must go hand-in-hand with safe practices and self-discipline,” said U.S. Secretary of Labor Eugene Scalia.
Worthy of mention, however, is though unemployment fell in May and June, the jobless rate and the number of unemployed are up by 7.6 percentage points and 12 million, respectively, since February. Additionally, the number of unemployed persons who were on temporary layoff decreased by 4.8 million to 10.6 million, following a decline of 2.7 million in May, but the number of permanent jobs lost continue to rise, increasing by 588,000 to 2.9 million in June.
At a macro level, The Conference Board has outlined three likely economic recovery scenarios, the details of which are below.
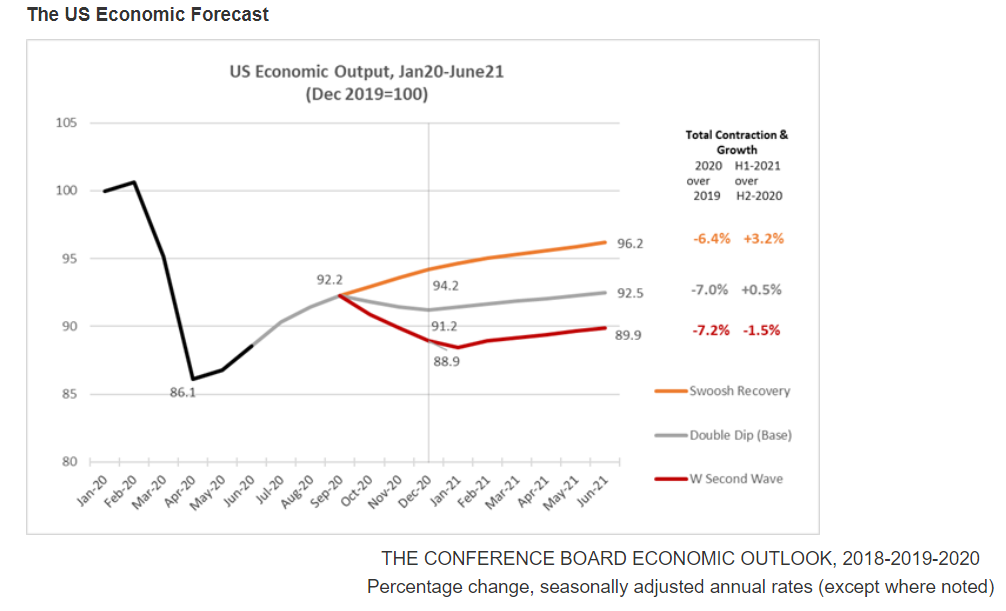
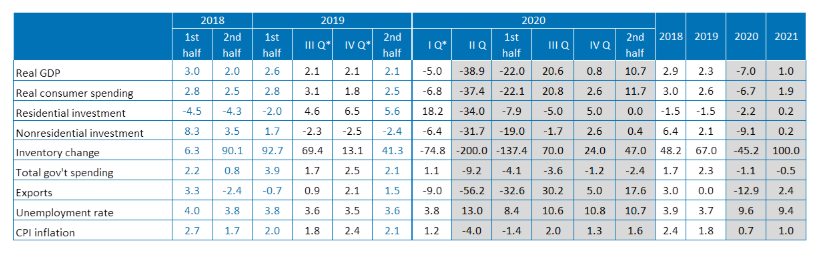
• The base forecast, referred to as the Double Dip, includes a second-quarter GDP contraction of nearly 40% (annualized). This large decrease is driven by a steep drop in consumer spending that equates to nearly 40%, a decline in real capital spending just over 30% and a fall in exports in excess of 50% (all annualized). Following a large rebound, perhaps 20% or more in Q3, growth is expected to slow to around 1% in Q4, which will bring the December 2020 level of economic output to approximately 93% of what it was a year earlier. Based on this updated forecast, U.S. GDP will contract by 7% for 2020 on the whole.
• If COVID-19 is brought under control rapidly, then unemployment could ease further and consumer confidence could rise, resulting in a stronger ‘Swoosh’-shaped recovery, which brings the economy back to pre-COVID-19 levels of output by the end of 2021.
• A large second wave of COVID-19 cases in the autumn could result in widespread economic lockdowns and yield a weaker ‘W’-shaped recovery that would hurt fourth-quarter growth and extend the economic crisis into 2021.
By Demographic
Unemployment rates declined among the major worker groups in June: adult men—10.2%, adult women—11.2%, teenagers—23.2%, Whites—10.1%, Hispanics—14.5% and Blacks—15.4%. The jobless rate for Asians—13.8%—changed little month-over-month.
By Industry
According to the U.S. Bureau of Labor Statistics, employment in leisure and hospitality increased by 2.1 million, accounting for approximately two-fifths of the gain in total nonfarm employment in June. Employment in food services and drinking places rose by 1.5 million month-over-month, following a gain of the same size in May. Despite these gains, employment in food services and drinking places is down by 3.1 million since February, reported the Bureau.
- Employment rose in amusements, gambling and recreation (+353,000), as well as in the accommodation industry (+239,000).
- Employment in retail trade rose by 740,000, after a gain of 372,000 in May and losses totaling 2.4 million in March and April combined. On net, employment in the industry is 1.3 million lower than in February.
- Notable job gains occurred in clothing and clothing accessories stores (+202,000), general merchandise stores (+108,000), furniture and home furnishings stores (+84,000) and motor vehicle and parts dealers (+84,000).
- Employment increased by 568,000 in education and health services but is 1.8 million below February’s level.
- Health care employment increased by 358,000, with gains in offices of dentists (+190,000), offices of physicians (+80,000) and offices of other health practitioners (+48,000). Elsewhere in health care, job losses continued in nursing care facilities (-18,000).
- Employment increased in the social assistance industry (+117,000), reflecting gains in child daycare services (+80,000) and in individual and family services (+28,000).
- Employment in private education rose by 93,000 over the month.
- Employment increased in the other services industry in June (+357,000), with about three-fourths of the increase occurring in personal and laundry services (+264,000).
- Since February, employment in the other services industry is down by 752,000.
- Manufacturing employment rose by 356,000 but is down by 757,000 since February. Recent increases were concentrated in the durable goods component, with motor vehicles and parts (+196,000) accounting for over half of the job gain in manufacturing. Employment also increased in miscellaneous durable goods manufacturing (+26,000) and machinery (+18,000). Within the nondurable goods component, the largest job gain occurred in plastics and rubber products (+22,000).
- Professional and business services added 306,000 jobs, but employment is 1.8 million below its February level.
- Employment rose in temporary help services (+149,000), services to buildings and dwellings (+53,000) and accounting and bookkeeping services (+18,000). By contrast, employment declined in computer systems design and related services (-20,000).
- Construction employment increased by 158,000, following a previous month gain of 453,000. These gains accounted for more than half of the decline in March and April (-1.1 million combined). Over-the-month gains occurred in specialty trade contractors (+135,000), with growth about equally split between the residential and nonresidential components. Job gains also occurred in the construction of buildings (+32,000).
- Transportation and warehousing added 99,000 jobs, following declines in the prior two months (-588,000 in April and May combined).
- Employment rose in warehousing and storage (+61,000), couriers and messengers (+21,000), truck transportation (+8,000) and support activities for transportation (+7,000).
- Wholesale trade employment rose by 68,000 but is down by 317,000 since February. Job gains occurred in durable goods (+39,000) and nondurable goods (+27,000) components.
- Financial activities added 32,000 jobs, with over half of the gain in real estate (+18,000). Since February, employment in financial activities is down by 237,000.
- Government employment changed little in June (+33,000), as job gains in local government education (+70,000) were partially offset by job losses in state government (-25,000). Government employment is 1.5 million below its February level.
- Mining continued to lose jobs (-10,000), with most of the decline occurring in support activities for mining (-7,000). Mining employment is down by 123,000 since a recent peak in January 2019, although nearly three-fourths of the decline has occurred since February 2020.


