KPI – January 2024: Consumer Trends
A synopsis of consumer confidence, sentiment & income/spending trends…

KPI – January 2024: State of Manufacturing
KPI – January 2024: State of Business
KPI – January 2024: State of the Economy
KPI – January 2024: Recent Vehicle Recalls
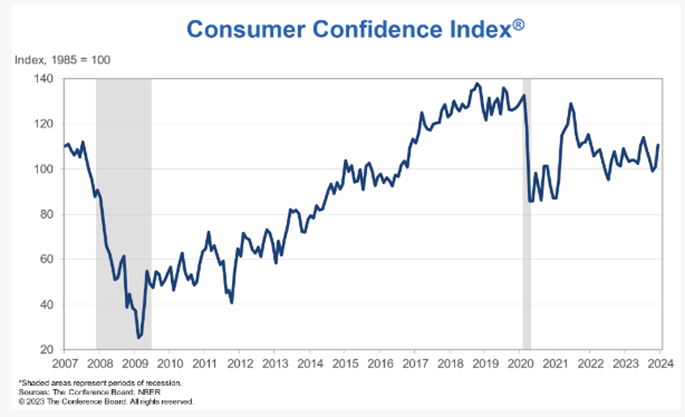
The Conference Board Consumer Confidence Index increased from a downwardly revised 101.0 in November to 110.7 (1985=100) in December. The Present Situation Index – based on consumers’ assessment of current business and labor market conditions – rose from 136.5 last month to 148.5 (1985=100) in December. Likewise, the Expectations Index – based on consumers’ short-term outlook for income, business and labor market conditions – increased from a downwardly revised reading of 77.4 in November to 85.6 (1985=100) in December.
According to Dana Peterson, chief economist at The Conference Board, “renewed optimism” was greatest among ages 35-54 and households with income levels at or above $125,000. In addition, she says overall assessments of the present situation ticked up in December, as seen by the more positive views of business conditions and the employment situation.
The Conference Board recorded a general improvement across the spectrum of data points, but Peterson says write-in responses showed consumers remain preoccupied with rising prices, politics, interest rates and global conflicts. For example, when asked to assess their current family financial conditions (a measure not included in calculating the Present Situation Index), there was a decrease among those saying “good” and an increase among those stating “bad.”
“This suggests consumers’ view of their current finances may paint a more tempered picture than the perception that overall conditions are better than a month ago,” Peterson says.
While consumers’ perceived likelihood of a U.S. recession over the next 12 months dropped, two-thirds still believe a downturn is likely/possible in 2024.
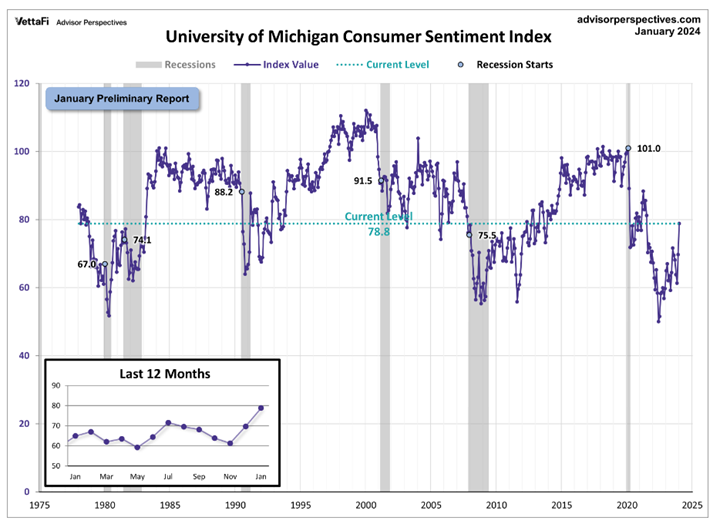
Similarly, the University of Michigan Survey of Consumers – a survey consisting of approximately 50 core questions covering consumers’ assessments of their personal financial situation, buying attitudes and overall economic conditions – finished at 78.8, a 13% month-over-month increase.
“Consumer views were supported by confidence that inflation has turned a corner and strengthening income expectations,” says Joanne Hsu, director of Survey of Consumers, noting the second straight month that all five index components rose, with a 27% surge in the short-run outlook for business conditions and a 14% gain in current personal finances. “Like December, there was a broad consensus of improved sentiment across age, income, education and geography. Democrats and Republicans alike showed their most favorable readings since summer of 2021.”
- Year-ahead inflation expectations softened to 2.9% after plunging in December.
- Long-run inflation expectations ticked down to 2.8%, falling below the 2.9-3.1% range seen for 26 of the last 30 months.
CONSUMER INCOME & SPENDING
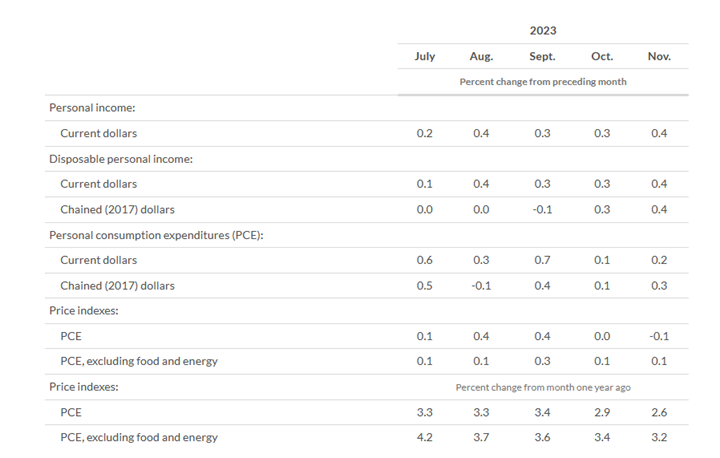
According to the U.S. Bureau of Economic Analysis (BEA), in November 2023 personal income increased $81.6 billion (0.4% at a monthly rate), while disposable personal income – personal income less personal current taxes – increased $71.9 billion (0.4%) and personal consumption expenditures (PCE) increased $46.7 billion (0.2%).
In addition, personal outlays – the sum of personal consumption expenditures, personal interest payments and personal current transfer payments – increased $47.8 billion in November. Personal saving was $839.8 billion and the personal saving rate – personal saving as a percentage of disposable personal income – registered 4.1%.
Important Takeaways, Courtesy of BEA:
- In November, the $46.7 billion increase in current-dollar PCE reflected an increase of $58.8 billion in spending for services and a decrease of $12.1 billion in spending for goods. Within services, the largest contributors to the increase were housing and utilities (led by housing), as well as food services and accommodations (led by purchased meals and beverages). Within goods, the leading contributor to the decrease was gasoline and other energy goods (led by motor vehicle fuels, lubricants and fluids).
- The PCE price index for November increased 2.6%. Prices for services swelled 4.1%, while prices for goods decreased 0.3%. Food prices increased 1.8%, but energy prices decreased 6%. Excluding food and energy, the PCE price index increased 3.2% year-over-year.