KPI — January 2022: State of the Economy
American households are trying to wrap their arms around the biggest price increases in four decades. From food, shelter and energy to vehicle and medical care costs, prices across the board are on the rise. One thing is for sure, “Uncomfortably hot inflation erodes most workers’ wage gains,” noted Megan Henney, author of December inflation breakdown: Where are rising prices hitting consumers the hardest?
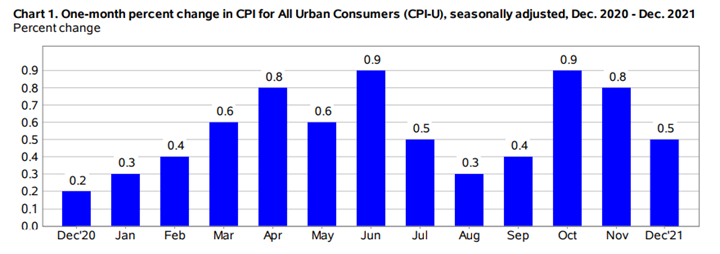
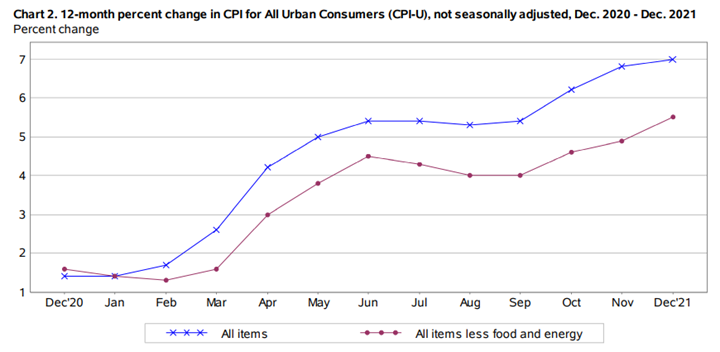
The Consumer Price Index for All Urban Consumers (CPI-U) increased another .5% in December on a seasonally adjusted basis after rising .8% in November, according to the U.S. Bureau of Labor Statistics. Over the last 12 months, the all items index increased 7% before seasonal adjustment, marking the fastest increase since June 1982 when inflation hit 7.1%.
Increases in the indexes for shelter, used cars and trucks, as well as food all largely contributed to the seasonally adjusted all items increase. The energy index, while still high, declined in December – falling .4%, as the indexes for gasoline and natural gas both declined.
Additionally, the index for all items less food and energy rose .6% following a .5% increase in November. The U.S. Bureau of Labor Statistics noted this was the sixth time in the last nine months that it has increased at least .5%. Along with the indexes for shelter and used cars and trucks, the indexes for household furnishings and operations, apparel, new vehicles and medical care all increased in December as well. As in November, the indexes for motor vehicle insurance and recreation were among the few to decrease month-over-month, noted the Bureau.
In addition to a 7% all items index increase, the all items less food and energy index rose 5.5% – the largest 12-month change since February 1991. Moreover, the energy index increased 29.3% year-over-year, while the food index increased 6.3%.
On the global front, “A high tide of growth, aided by a sea change in fiscal policy, is likely to help float the global economy safely over the rocks of risks in 2022, despite waves of worries emanating from COVID, inflation, shortages and rate hikes,” said Jeffrey Kleintop, author of 2022 Global Outlook: Slowing But Not Slow. Review the 2022 Schwab Market Outlook here.
Employment
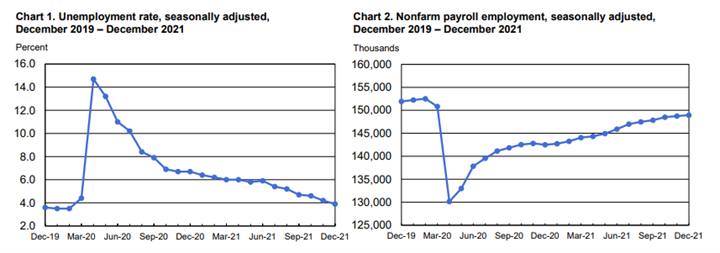
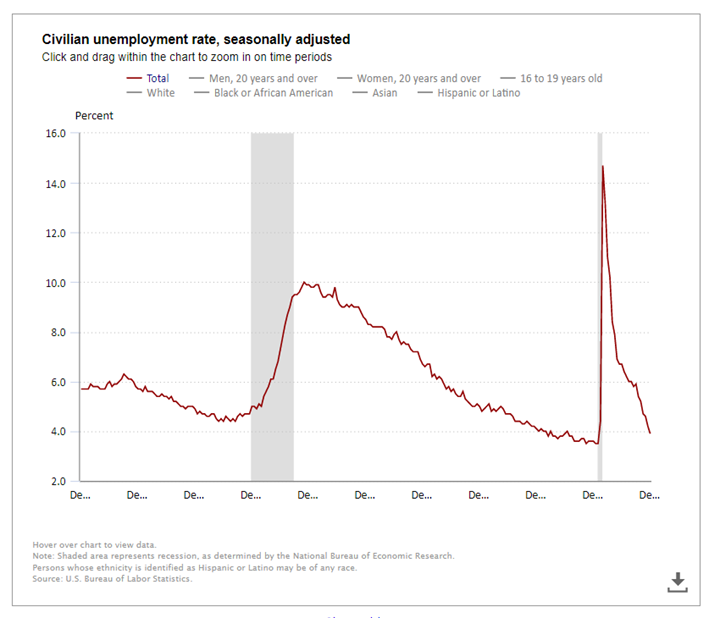
Total nonfarm payroll employment rose by 199,000 in December, as the unemployment rate declined to 3.9%; however, the report is far below Dow Jones’ and Goldman Sachs’ estimates of 422,000 and 500,000, respectively.
David Lynch of the Washington Post said, “The jobs forecast was both an unmitigated flop and an illustration of how difficult the pandemic makes it for even the most astute observers to assess the $23 trillion economy.” Case in point:
Ian Shepherdson knew he was sticking his neck out. But last Thursday, he went public with a startling forecast: The next government labor market report would show that the U.S. economy had created 850,000 jobs in December.
Less than 24 hours later, it became clear that Shepherdson, the chief economist and founder of Pantheon Macroeconomics, had missed the mark and missed badly. – David J. Lynch, The Washington Post
Positively, private job growth totaled 807,000 for the month, well ahead of the Dow Jones estimate for 375,000 and the November revised gain of 505,000. The total was the best for the job market since May 2021′s 882,000 figure, according to the ADP data.

The Conference Board Employment Trends Index™ (ETI) increased in December. The index now stands at 116.63, up from 115.64 in November.
Important Takeaways, Courtesy of the Bureau of Labor Statistics:
- The number of people on temporary layoff was little changed at 812,000 and remains down by 2.3 million year-over-year. According to the most recent report, the number on temporary layoff has essentially returned to its February 2020 level.
- Among the unemployed, the number of permanent job losers, currently at 1.7 million, declined by 202,000 but remains down by 1.8 million year-over-year. The number of permanent job losers in December is 408,000 higher than in February 2020.
- The number of long-term unemployed (those jobless for 27 weeks or more) declined by 185,000 to 2 million in December. The figure is down from 4 million a year earlier but remains 887,000 higher than in February 2020. The long-term unemployed accounted for 31.7% of the total unemployed in December.
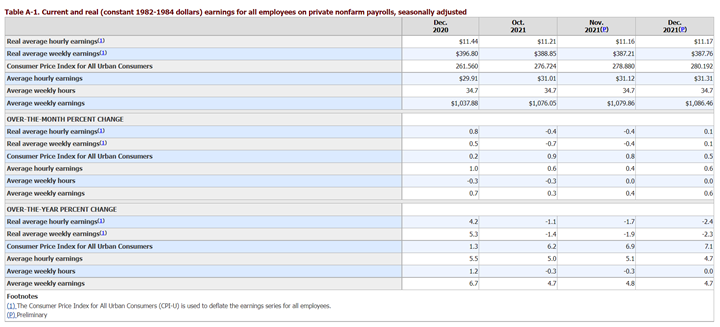
Real average hourly earnings for all employees increased .1% from November to December, seasonally adjusted, according to the U.S. Bureau of Labor Statistics. This result stems from an increase of .6% in average hourly earnings combined with an increase of .5% in the Consumer Price Index for All Urban Consumers (CPI-U). Real average weekly earnings increased .1% month-over-month due to the change in real average hourly earnings combined with no change in the average workweek. Real average hourly earnings decreased 2.4% year-over-year, seasonally adjusted. The change in real average hourly earnings combined with no change in the average workweek resulted in a 2.3% decrease in real average weekly earnings over this period.
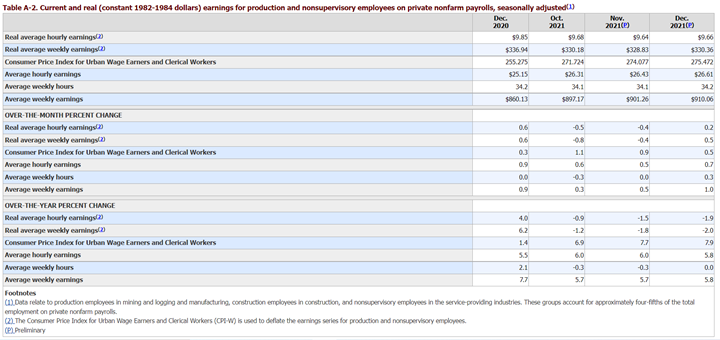
Real average hourly earnings for production and nonsupervisory employees increased .2% month-over-month, seasonally adjusted. This result stems from a .7% increase in average hourly earnings combined with an increase of .5% in the Consumer Price Index for Urban Wage Earners and Clerical Workers (CPI-W). Real average weekly earnings increased .5% month-over-month due to the change in real average hourly earnings combined with an increase of .3% in average weekly hours. From December 2020 to December 2021, real average hourly earnings decreased 1.9%, seasonally adjusted. The change in real average hourly earnings combined with no change in the average workweek resulted in a 2% decrease in real average weekly earnings over this period.
By Demographic
Unemployment rates among the major worker groups: adult men and women – 3.6%; teenagers – 10.9%; White – 3.2%; Asian – 3.8%; Hispanic – 4.9%; and Black – 7.1%.
By Industry
Nonfarm employment increased by 18.8 million since April 2020 but is down by 3.6 million, or 2.3%, compared to its pre-pandemic level in February 2020.
Important takeaways, courtesy of the U.S. Bureau of Labor Statistics:
- Employment in leisure and hospitality continued to trend up (+53,000). Leisure and hospitality added 2.6 million jobs in 2021, but employment in the industry is down by 1.2 million, or 7.2%, since February 2020. Employment in food services and drinking places rose by 43,000 in December but remains down by 653,000 since February 2020.
- Employment in professional and business services rose (+43,000). Job gains occurred in computer systems design and related services (+10,000), architectural and engineering services (+9,000) and scientific research and development services (+6,000). Employment in professional and business services overall is slightly below (-35,000) its level in February 2020.
- Manufacturing added 26,000 jobs, primarily in durable goods industries. A job gain in machinery (+8,000) reflected the end of a strike and return of workers. Manufacturing employment is down by 219,000 since February 2020.
- Employment in transportation and warehousing increased by 19,000. Job gains occurred in support activities for transportation (+7,000), air transportation (+6,000) and warehousing and storage (+5,000). Employment in couriers and messengers was essentially unchanged. Since February 2020, employment in transportation and warehousing is up by 218,000, reflecting job growth in couriers and messengers (+202,000) and warehousing and storage (+181,000).
- Construction employment increased by 22,000, following monthly gains averaging 38,000 over the prior three months. Job gains occurred in nonresidential specialty trade contractors (+13,000) and heavy and civil engineering construction (+10,000). Construction employment is 88,000 below its February 2020 level.
Review all employment statistics here.
The Employment Trends Index increased in December and, per the latest data, job growth is likely to be strong in 2022, noted Gad Levanon, head of The Conference Board Labor Markets Institute.
“Nevertheless, in the very short term, job growth may be tepid as the fallout from Omicron continues,” he pointed out. In-person service industries like restaurants, hotels, personal care, entertainment and even passenger transportation will be most impacted in the form of lower consumer spending, thus leading to less hiring.
“In addition, an increasing number of sick or quarantined employees will force businesses to operate at lower capacity and dampen overall economic activity,” he said. As such, office environments will remain virtual, or at least hybrid, for the foreseeable future.
Levanon said labor shortages continue to be severe and likely will remain that way going forward. “High wage pressures will continue to feed into price inflation, and service employers will need to automate quickly to make up for the labor shortfall,” he explained.
KPI — January 2022: Consumer Trends
Key Performance Indicators Report — January 2022


