KPI — January 2022: Consumer Trends
The Conference Board Consumer Confidence Index® increased slightly in December. The Index now stands at 115.8 (1985=100), up from 111.9 (an upward revision) in November. The Present Situation Index – based on consumers’ assessment of current business and labor market conditions – was relatively flat at 144.1, down from 144.4 last month. The Expectations Index – based on consumers’ short-term outlook for income, business and labor market conditions – rose to 96.9 from 90.2.
“Consumer confidence improved further in December, following a very modest gain in November,” said Lynn Franco, senior director of economic indicators at The Conference Board. The Present Situation Index decreased slightly “but remains very high,” suggesting the economy maintained its momentum during the final month of 2021, according to Franco.
Additionally, the proportion of consumers planning to purchase homes, automobiles, major appliances and vacations over the next six months all increased, according to the most recent data. As such, expectations about short-term growth prospects improved, raising hope for a continued climb in early 2022. Regardless, both confidence and consumer spending will continue to face headwinds from rising prices and an expected winter surge of the pandemic, Franco noted.
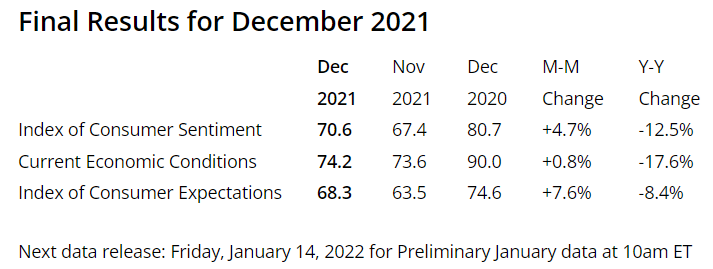
Similarly, The Consumer Sentiment Index – a survey consisting of approximately 50 core questions covering consumers’ assessments of their personal financial situation, buying attitudes and overall economic conditions – increased slightly in December, but rising prices remains a top concern. At 70.6, “Consumers’ evaluations of their current finances remained unchanged at lower levels due to the erosion of their living standards from rising inflation. One-in-four households specifically cited the negative impact of inflation on their living standards,” according to the University of Michigan Survey of Consumers.
With a sharp rise in inflation and COVID-19 omicron cases, economists have more questions than answers. As sickness spikes, supply shortages are expected to tighten further.
Consumer Income & Spending
According to the U.S. Bureau of Economic Analysis (BEA), personal income increased $90.4 billion in November, or .4%, while consumer spending rose $104.7 billion, or .6%. The increase in personal income primarily reflected increases in compensation of employees and government social benefits, noted BEA. The personal saving rate, i.e., personal saving as a percentage of disposable personal income, dipped to 6.9% compared to 7.1% in October.
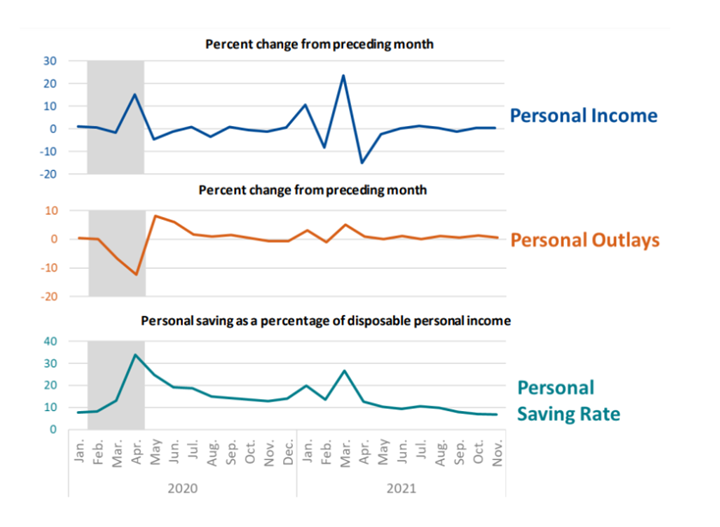
The increase in personal income mainly reflected a boost in compensation from employees and government social benefits. Partly offsetting these increases was a decrease in proprietors’ income, explained BEA. Personal outlays also rose in November, in connection with an increase in consumer spending on services.
- Increases in housing and utilities, led by electricity and gas, based on projections from the Energy Information Administration (EIA)
- Increases in food services and accommodations, based on data from the Census Monthly Retail Trade Survey (MRTS) as well as private data
- Increases in health care, led by outpatient services, based on data from the BLS CES as well as private data
Important Takeaways, Courtesy of BEA
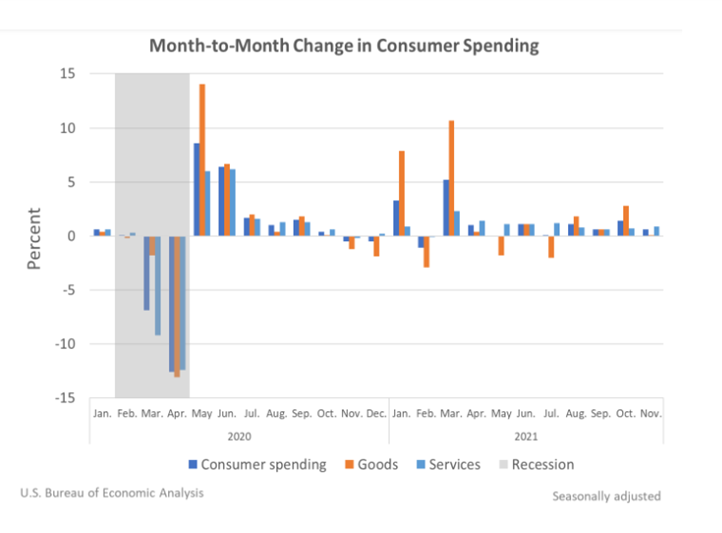
- Within goods, an increase in nondurable goods was partly offset by a decrease in durable goods. The increase in nondurable goods reflected increases in gasoline and other motor fuels, based on EIA volume data and BLS Consumer Price Indexes, as well as food and beverages, based on data from Census MRTS.
- The decrease in durable goods primarily reflected decreases in recreational goods and vehicles, led by video, audio, photographic and information processing equipment, based on data from Census MRTS, as well as motor vehicles and parts, led by new motor vehicles (light trucks), based on data from Wards Intelligence.
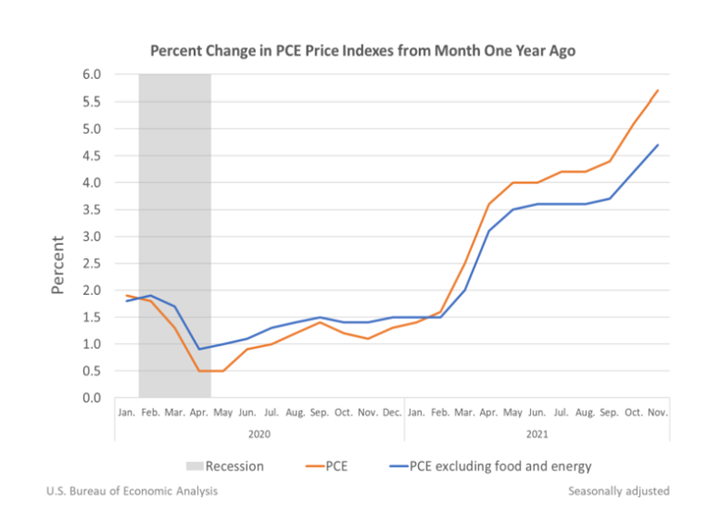
- The personal consumption expenditures price index for November increased 5.7% year-over-year, reflecting increases in both goods and Energy prices increased 34%, while food prices increased 5.6%. Excluding food and energy, the PCE price index for November increased 4.7% year-over-year.
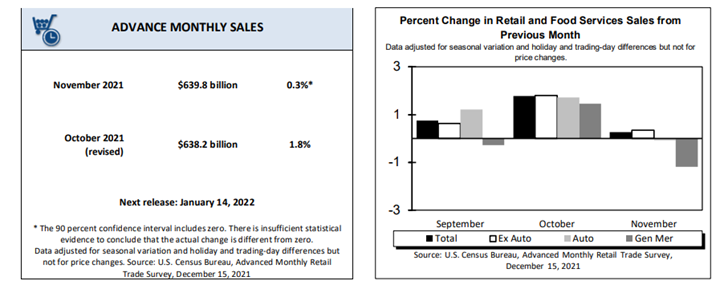
Advance estimates of U.S. retail and food services sales for November 2021 – adjusted for seasonal variation and holiday and trading-day differences but not for price changes – were $639.8 billion, an increase of .3% (±.5%)* from the previous month, and 18.2% (±.9%) above November 2020. Total sales for the September 2021 through November 2021 period were up 16.2% (±.7%) year-over-year. The September 2021 to October 2021 percent change was revised from up 1.7% (±.5%) to up 1.8% (±.2%). Retail trade sales were up .2% (±.4%)* from October 2021 and up 16.1% (±.7%) above last year. Gasoline stations were up 52.3% (±1.6 percent) from November 2020, while food services and drinking places were up 37.4% (±3.9%) from last year.
Key Performance Indicators Report — January 2022


