KPI — December 2021: State of the Economy

November marked the highest consumer price hike in nearly four decades, according to reports. American wallets absorbed financial increases across the board, from gas and groceries to vehicles – confirming inflation as a cornerstone of the current economy.
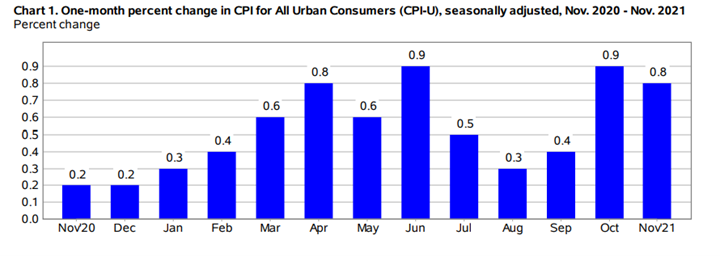
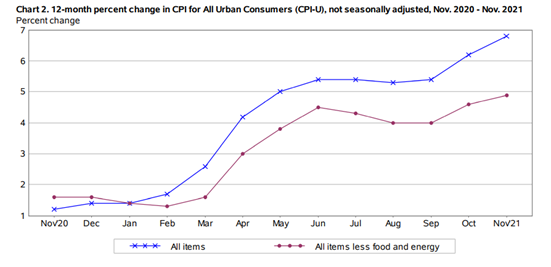
The Consumer Price Index for All Urban Consumers (CPI-U) increased 0.8% in November on a seasonally adjusted basis after rising 0.9% in October, according to the U.S. Bureau of Labor Statistics. Over the last 12 months, the all items index increased 6.8% before seasonal adjustment – the largest 12-month increase since the period ending June 1982.
The indexes for gasoline, shelter, food, used cars and trucks, as well as new vehicles were among the larger contributors to the monthly all items seasonally adjusted increase. The energy index jumped 3.5%, as the gasoline index increased 6.1% alongside other major energy component indexes.
The index for all items less food and energy rose 0.5% in November following a 0.6% increase in October. The indexes for household furnishings and operations, apparel and airline fares also increased. Meanwhile, the indexes for motor vehicle insurance, recreation and communication all declined in November.
Over the last 12 months, the index for all items less food and energy rose 4.9% while the energy index rose 33.3% year-over-year, and the food index increased 6.1%. These changes are the largest 12-month increases in at least 13 years in the respective series, according to the Bureau of Labor Statistics.
Review global input of current economic conditions and future trajectory predictions here.
Employment
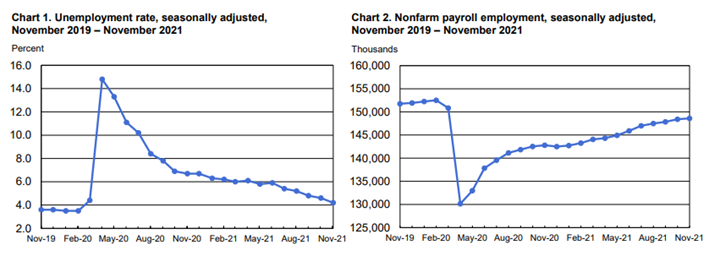
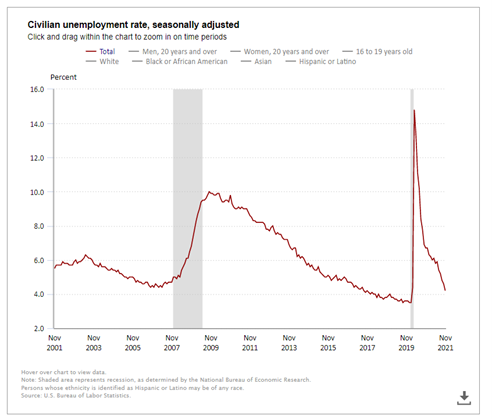
Total nonfarm payroll employment increased by 210,000 in November, and the unemployment rate fell 0.4 percentage point to 4.2%; however, the report is far below economists’ predictions of 573,000 job gains.
Additionally, an ongoing decline in labor force participation, particularly among prime-age workers, poses an issue for productivity and growth, according to S&P Global Ratings. For example, last month’s 4.6% unemployment rate is actually the equivalent of 6.4% when adjusted for the labor force exit.
Important Takeaways, Courtesy of the Bureau of Labor Statistics:
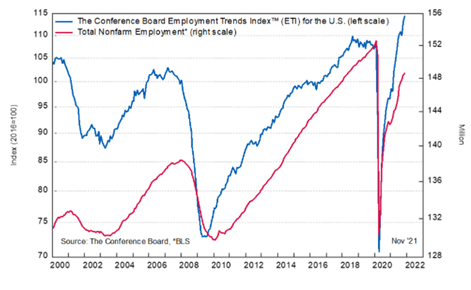
The Conference Board Employment Trends Index™ (ETI) increased slightly in November. The index now stands at 114.49, up from 113.03 in October (an upward revision).
- The number of persons on temporary layoff decreased by 255,000 to 801,000 in November. This measure is down from a high of 18 million in April 2020, nearly returning to its February 2020 level of 750,000.
- Among the unemployed, the number of permanent job losers declined by 205,000 to 1.9 million, but remains 623,000 higher than in February 2020.
- The number of long-term unemployed (those jobless for 27 weeks or more) is 2.2 million – approximately 1.1 million higher compared to February 2020. The long-term unemployed accounted for 32.1% of the total unemployed in November.
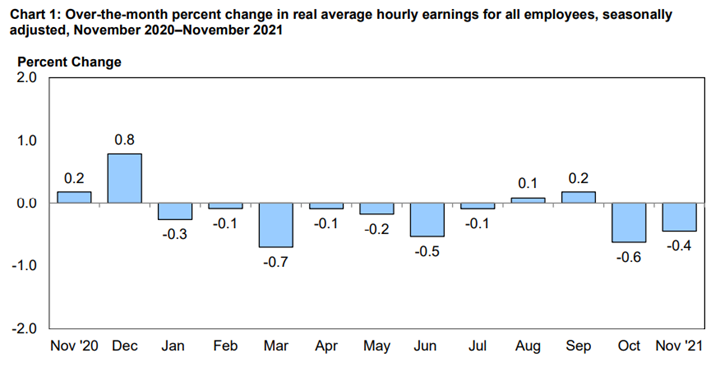
According to the U.S. Bureau of Labor Statistics, real average hourly earnings for all employees decreased 0.4% from October to November, seasonally adjusted. This result stems from an increase of 0.3% in average hourly earnings combined with an increase of 0.8% in the Consumer Price Index for All Urban Consumers (CPI-U). Real average weekly earnings decreased 0.2% month-over-month due to the change in real average hourly earnings combined with an increase of 0.3% in the average workweek.
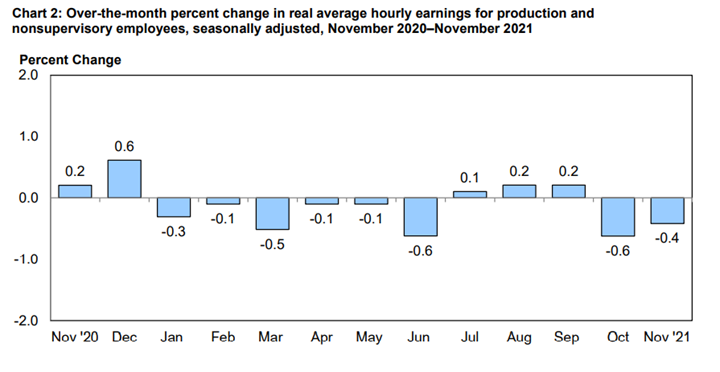
Real average hourly earnings decreased 1.9% year-over-year, seasonally adjusted. The change in real average hourly earnings combined with no change in the average workweek resulted in a 1.9% decrease in real average weekly earnings over this period.
By Demographic
Unemployment rates among the major worker groups: adult men and women – 4.0%; teenagers – 11.2%; White – 3.7%; Asian – 3.8%; Hispanic – 5.2%; and Black – 6.7%.
By Industry
Nonfarm employment increased by 18.5 million since April 2020 but remains down 3.9 million, or 2.6%, compared to its pre-pandemic level in February 2020. This month, notable job gains occurred in professional and business services, transportation and warehousing, construction and manufacturing.
Important takeaways, courtesy of the U.S. Bureau of Labor Statistics:
- Professional and business services added 90,000 jobs. Job gains continued in administrative and waste services (+42,000), although employment in its temporary help services component changed little (+6,000). Job growth also continued in management and technical consulting services (+12,000) and in computer system design and related services (+10,000). Employment in professional and business services overall is 69,000 below its level in February 2020.
- Employment in transportation and warehousing increased by 50,000 and is 210,000 above its February 2020 level. Job gains occurred in couriers and messengers (+27,000) and in warehousing and storage (+9,000).
- Manufacturing added 31,000 jobs, with gains in miscellaneous durable goods manufacturing (+10,000) and fabricated metal products (+8,000), while motor vehicles and parts lost jobs (-10,000). Employment in machinery declined by 6,000, largely reflecting a strike. Manufacturing employment is down by 253,000 since February 2020.
- Construction employment rose by 31,000. Employment continued to trend up in specialty trade contractors (+13,000), construction of buildings (+10,000) and heavy and civil engineering construction (+8,000). Construction employment remains 115,000 below its February 2020 level.
Review all employment statistics here.

“On its current trajectory, much of the job growth ahead should come from sectors still in the process of reopening, including restaurants, hotels, entertainment, personal services and passenger transportation. These industries are relatively labor intensive, so their further recoveries will be key for sustaining strong job growth,” stated Gad Levanon, head of The Conference Board Labor Markets Institute.
“At the same time, labor supply will struggle to meet the demand for workers, as the U.S. working-age population stagnates and Baby Boomers drop out of the workforce. We currently project the unemployment rate – already down to 4.2% – to approach 3% by the end of 2022, which would mark a 70-year low,” he continued.
“Indeed, even if pandemic disruptions to labor supply fully subside in the year ahead, a tight labor market is likely here for the foreseeable future. Employers should expect recruiting difficulties and quit rates to remain high, fueling the upward pressure on wages,” Levanon said.
KPI — December 2021: Consumer Trends
Key Performance Indicators Report — December 2021


