KPI — August: State of the Manufacturing Sector

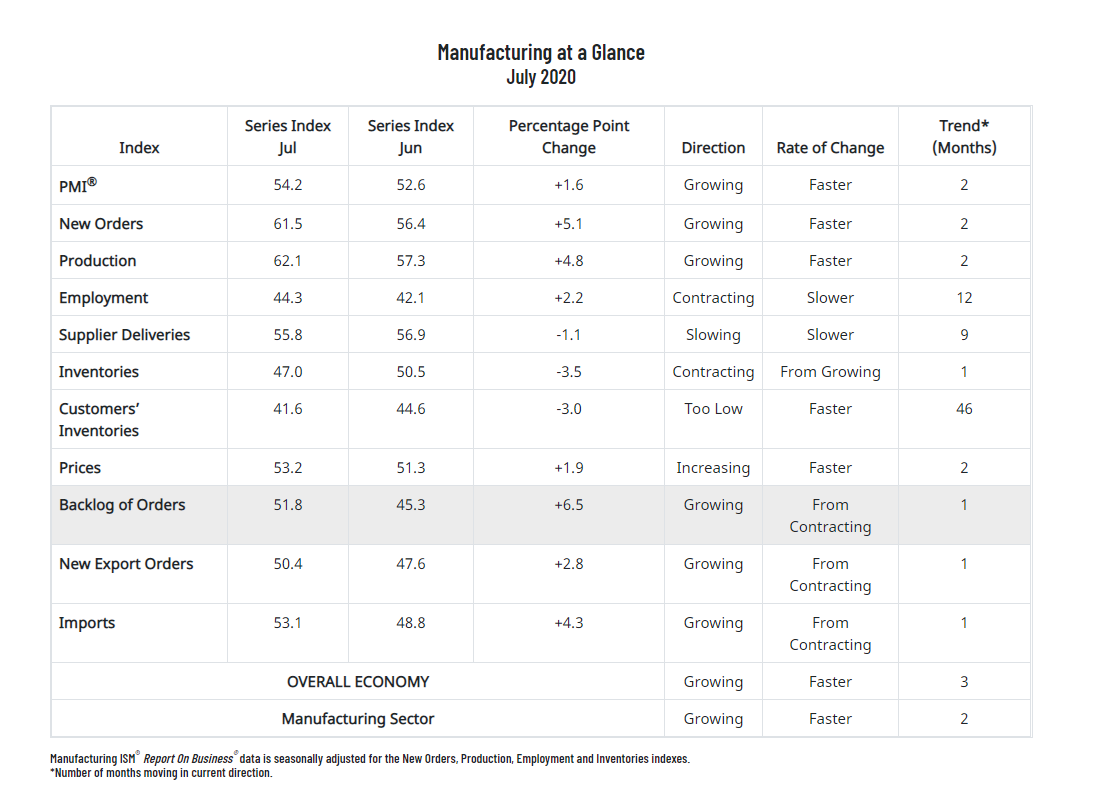
Economic activity in the manufacturing sector grew in July, with the overall economy securing a third consecutive month of growth, according to the nation’s supply executives in the latest Manufacturing ISM® Report On Business®. The July PMI® registered 54.2%, up 1.6 percentage points from the June reading of 52.6%.
The Report On Business® measures its data using the Purchasing Manager’s Index (PMI), which is an indicator of economic health in the manufacturing sector. A reading above 50% indicates that the manufacturing economy is generally expanding, while below 50% indicates that it is generally contracting. All data and analysis are courtesy of Institute for Supply Management.
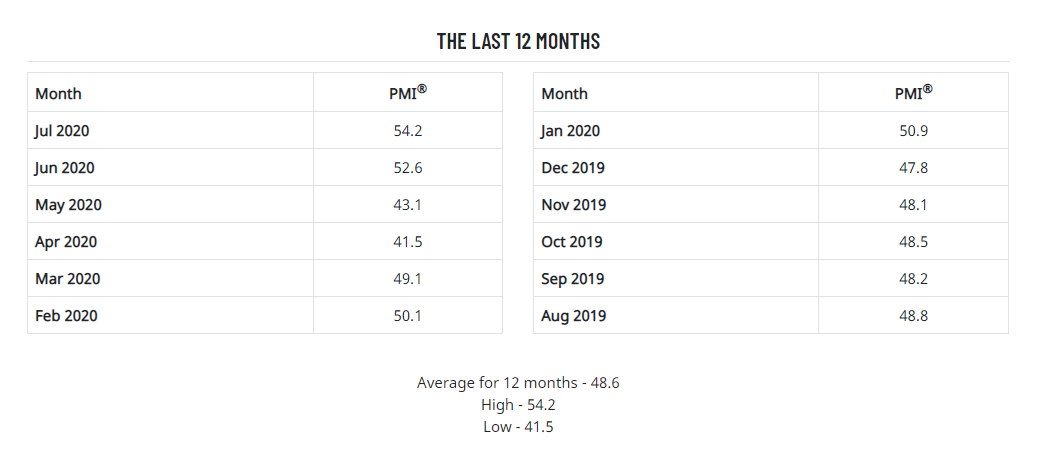
“In July, manufacturing continued its recovery after the disruption caused by the coronavirus (COVID-19) pandemic. This figure (54.2%) indicates expansion in the overall economy for the third month in a row after a contraction in April, which ended a period of 131 consecutive months of growth,” said Timothy R. Fiore, CPSM, C.P.M., Chair of the Institute for Supply Management® (ISM®) Manufacturing Business Survey Committee.
“Demand and consumption continued to drive expansion growth, with inputs remaining at parity with supply and demand. Among the six biggest industry sectors, Food, Beverage & Tobacco Products remains the best-performing industry sector, with Chemical Products, Computer & Electronic Products and Petroleum & Coal Products growing respectably. Transportation Equipment and Fabricated Metal Products continue to contract, but at soft levels,” added Fiore.
• Demand expanded, with the (1) New Orders Index growing at a strong level, supported by the New Export Orders Index re-entering expansion
• Customers’ Inventories Index remained at a level considered a positive for future production
• Backlog of Orders Index returned to expansion for the first time in five months.
• Consumption (measured by the Production and Employment indexes) contributed positively (a combined 7-percentage point increase) to the PMI® calculation, with industries continuing to expand output after May’s return-to-work actions.
• Inputs—expressed as supplier deliveries, inventories and imports—weakened for the third straight month due to supplier delivery issues abating and import levels re-entering expansion. Inventory levels contracted due to strong production output, supplier delivery difficulties and inventory minimization. Inputs contributed negatively (a combined 4.6-percentage point decrease) to the PMI® calculation but were more than offset by the demand and consumption improvement, as was the case in June.
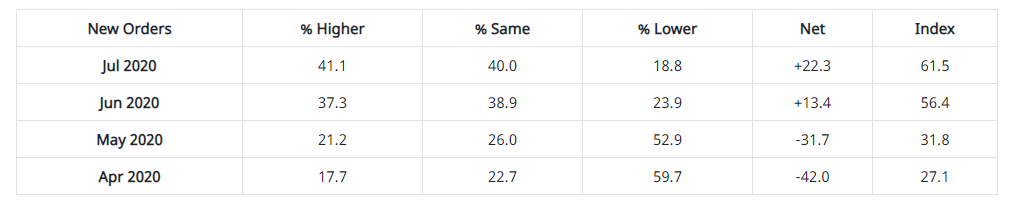
ISM®’s New Orders Index registered at 61.5% in July, an increase of 5.1 percentage points compared to the 56.4% reported in June. This indicates that new orders grew for the second consecutive month. “All of the top six industry sectors (Chemical Products; Food, Beverage & Tobacco Products; Fabricated Metal Products; Petroleum & Coal Products; Transportation Equipment and Computer & Electronic Products) expanded. Demand improved in July, as demonstrated by 13 industry sectors expanding and only two contracting. The index achieved its highest level of performance since September 2018 (61.8%),” explained Fiore. A New Orders Index above 52.5*, over time, is generally consistent with an increase in the Census Bureau’s series on manufacturing orders (in constant 2000 dollars).
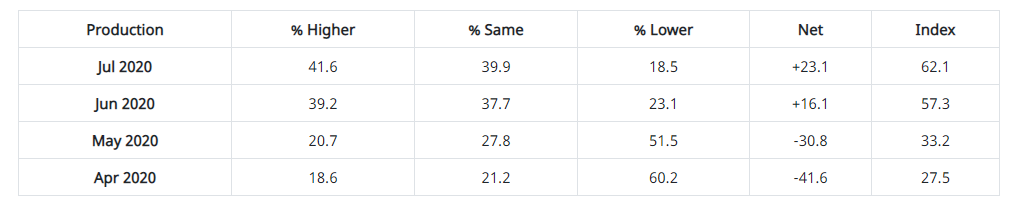
The Production Index registered at 62.1% in July, up 4.8 percentage points from 57.3% in June, indicating growth for the second consecutive month. “Five of the top six industries expanded strongly and none contracted, a marked improvement from June. The index achieved its highest level of performance since August 2018, when it registered at 63.1%,” said Fiore. An index above 51.7%, over time, is generally consistent with an increase in the Federal Reserve Board’s Industrial Production figures.
Thirteen of 18 manufacturing industries reported growth in July: Wood Products, Furniture & Related Products, Textile Mills, Printing & Related Support Activities, Food, Beverage & Tobacco Products, Plastics & Rubber Products, Chemical Products, Apparel, Leather & Allied Products, Computer & Electronic Products, Primary Metals, Petroleum & Coal Products, Miscellaneous Manufacturing and Electrical Equipment, Appliances & Components. The three industries reporting contraction include Transportation Equipment, Machinery and Fabricated Metal Products.
- Commodities Up in Price: Aluminum (2), Copper (2), Crude Oil (3), Diesel Fuel (2), High-Density Polyethylene, Lumber, Oil-Based Products, Plastic Products, Polypropylene and Precious Metals
- Commodities Down in Price: Diesel Fuel (5), Steel—Hot Rolled and Steel Products (4)
- Commodities in Short Supply: Alcohols, Personal Protective Equipment (PPE) (3), PPE—Gloves (5), PPE—Masks and Sanitizers & Disinfectants (2)
Note: The number of consecutive months the commodity is listed is indicated after each item. *Indicates both up and down in price.
What Respondents Are Saying
- “Orders starting to pick up. [An] increase of about 35-40%.” (Chemical Products)
- “Overall business remains down almost 70%. We are hanging on to as many employees as possible, but we will have to lay off 30% or more for at least two to three months until September or October.” (Transportation Equipment)
- “While demand in [the] coming six months is stabilizing, it is at a significant reduction and clear [that] customers have little confidence in the forecasts. Export orders to Brazil, South Africa [and the] Middle East are largely cancelled for the balance of 2020.” (Fabricated Metal Products)
- “Manufacturing outlook has improved greatly in June, as business has resumed at nearly 100%. We have implemented a number of safeguards that are costing extra money, but we are running.” (Computer & Electronic Products)
- “Stabilizing demand for refrigerated and frozen beverage and dessert, but still at a higher level than a year ago. Uncertainty of school opening in the fall: How much demand will continue or shift will be dictated by students returning to school or not.” (Food, Beverage & Tobacco Products)
- “Uncertainty regarding our industry and business has not improved. We are developing the 2021 budget around multiple scenarios.” (Petroleum & Coal Products)
- “Incoming orders are slow. This is usually our busiest time of the year, but production is reduced due to lack of demand. Additional layoffs expected.” (Furniture & Related Products)
- “General business climate continues to be subdued, driving highly conservative forecasting due to variability in the ongoing pandemic-driven conditions and economic response.” (Machinery)
- “We are still seeing our customers shut down or effected by COVID-19. We are hoping for a bounce back in September.” (Miscellaneous Manufacturing)
- “General business conditions are in a general slowing pattern. Many of the plants are on reduced hours and/or furloughs. About 20-25% of plants are scheduled to be consolidated in the next six months to improve margins and profitability.” (Nonmetallic Mineral Products)
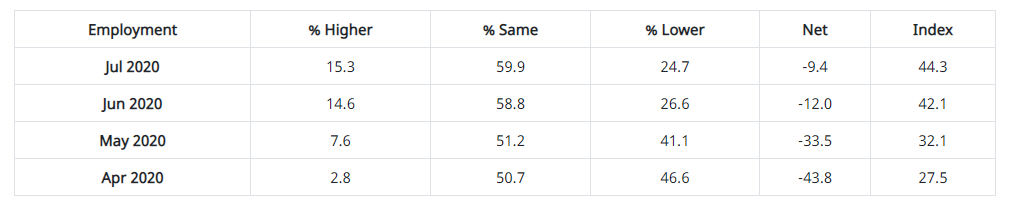
ISM®’s Employment Index registered at 44.3% in July, 2.2 percentage points higher than the June reading of 42.1%. “This is the 12th consecutive month of employment contraction, at a slower rate compared to June. Only one of the six big industry sectors experienced expansion, as factories were able to achieve significant gains in output with a reduced labor pool. Long-term labor market growth remains uncertain, but strong new-order levels and an expanding backlog signify potential strength for the rest of the third quarter,” added Fiore. An Employment Index above 50.8%, over time, is generally consistent with an increase in the Bureau of Labor Statistics (BLS) data on manufacturing employment.
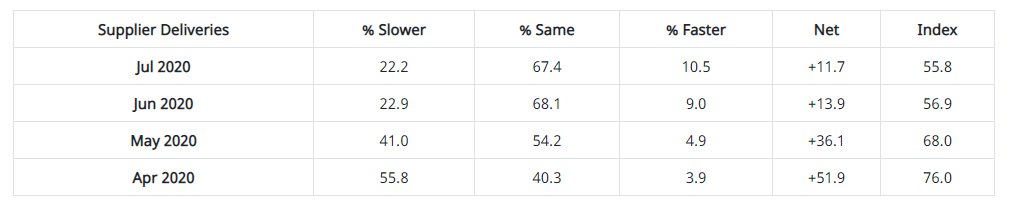
The delivery performance of suppliers to manufacturing organizations was slower in July, as the Supplier Deliveries Index registered 55.8%. This is 1.1 percentage points lower than the 56.9% reported in June. “Suppliers continue to struggle to deliver, although at a slower rate compared to June. Plant interruptions, transportation challenges and continuing difficulties in supplier labor markets are still factors. The Supplier Delivery Index continues to reflect a healthier supply/demand balance compared to spring and early summer,” said Fiore. A reading below 50% indicates faster deliveries, while a reading above 50 percent indicates slower deliveries.
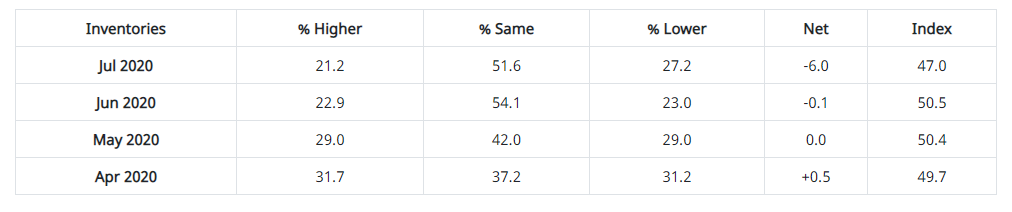
The Inventories Index registered at 47% in July, 3.5 percentage points lower than the 50.5% reported for June. Inventories contracted after two consecutive months of expansion. “Inventory levels were impacted by increases in production output and restrained by continuing supplier difficulties. Panelists also indicated restraint in increasing inventories due to uncertainty in overall future market demand,” explained Fiore. An Inventories Index greater than 44.3%, over time, is generally consistent with expansion in the Bureau of Economic Analysis (BEA) figures on overall manufacturing inventories (in chained 2000 dollars).
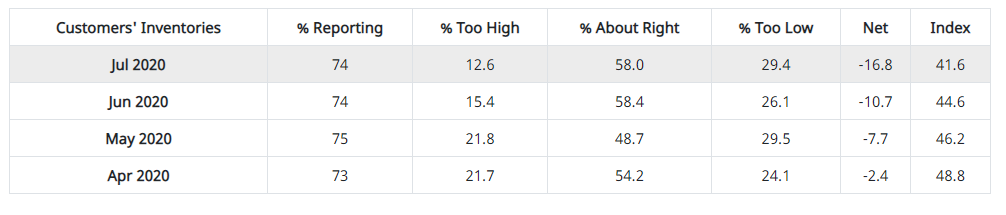
ISM®’s Customers’ Inventories Index registered at 41.6% in July, three percentage points lower than the 44.6% reported for June, indicating that customers’ inventory levels were considered too low. “Customers’ inventories are too low for the 46th consecutive month and moved further into ‘too low’ territory in July, a positive for future production,” explained Fiore.
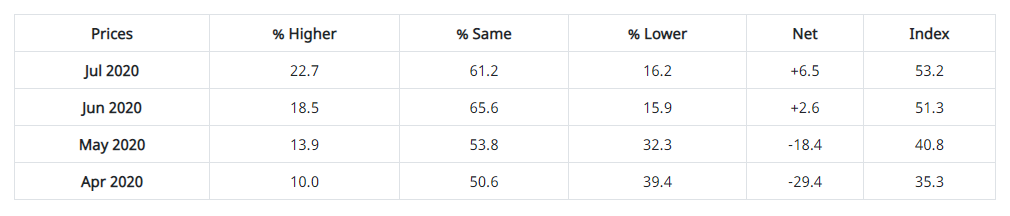
The ISM® Prices Index registered at 53.2%, 1.9 percentage points higher than the June reading of 51.3%, indicating raw materials prices increased for the second consecutive month. “Price increases were driven primarily by plastics, lumber, aluminum, copper and petroleum products. Price growth remains at a stable supplier/buyer relationship,” added Fiore. A Prices Index above 52.5%, over time, is generally consistent with an increase in the Bureau of Labor Statistics (BLS) Producer Price Index for Intermediate Materials.
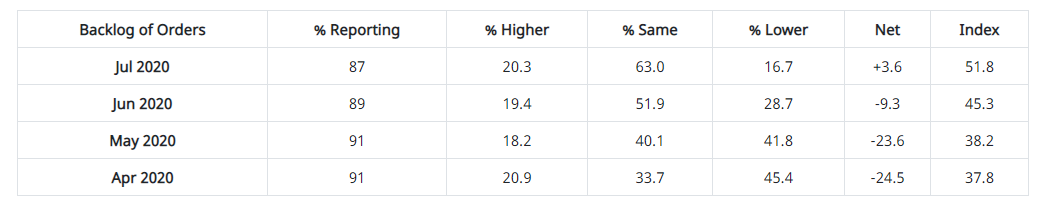
ISM®’s Backlog of Orders Index registered at 51.8% in July, a 6.5-percentage point increase compared to the 45.3% reported in June, indicating order backlogs expanded after four consecutive months of contraction. “The return of backlog expansion is a positive for the future. Backlog expansion indicates that new-order intake was sufficient to offset production output and grow backlog during the period. Three of the six big industry sectors’ backlogs expanded, an improvement from June. The index achieved its highest level of expansion since April 2019 (53.9%),” said 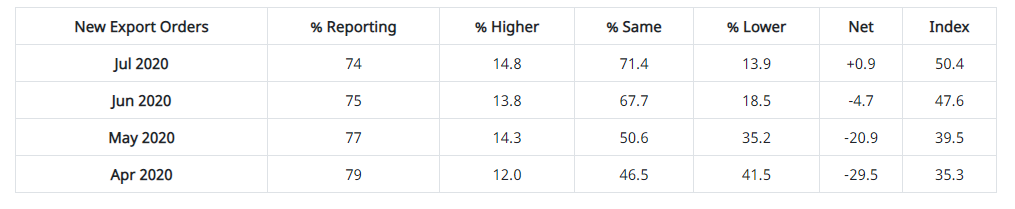
ISM®’s New Export Orders Index registered at 50.4% in July, up 2.8 percentage points compared to the June reading of 47.6%. “The New Export Orders Index expanded modestly after four straight months of contraction, with two of the six big industry sectors expanding. New export orders were a positive factor to the growth in new orders,” said Fiore.
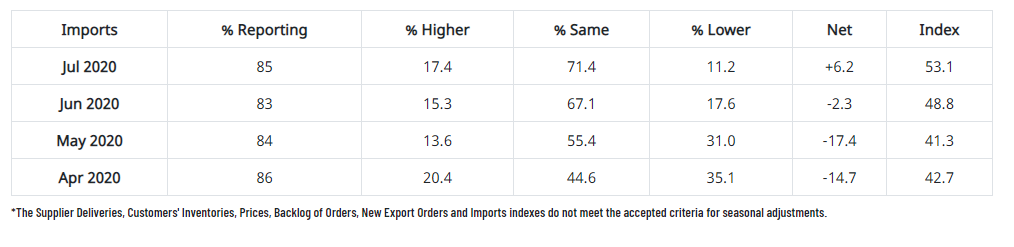
ISM®’s Imports Index registered at 53.1% in July, up 4.3 percentage points compared to the 48.8% reported for June. “Imports expanded after five consecutive months of contraction, reflecting increased U.S. demand. The index reached its highest level of expansion since February 2019, when it registered 55.3%,” said Fiore.
Key Performance Indicators Report — August 2020