KPI — August: State of the Economy

The U.S. economy continues to claw its way out of the single largest quarterly contraction in 75 years, with a second quarter 2020 GDP rate of -32.9% (annualized rate compared to the first quarter of 2020), according to The Conference Board.
As White House economic advisor Larry Kudlow recently addressed on CNN’s “State of the Union,” various economic indicators point to a greater-than-expected growth rate and V-shaped recovery. “However, a new surge of COVID-19 cases in various parts of the country is threatening to dampen the recovery path,” added The Conference Board, which has outlined two likely economic recovery scenarios of its own:
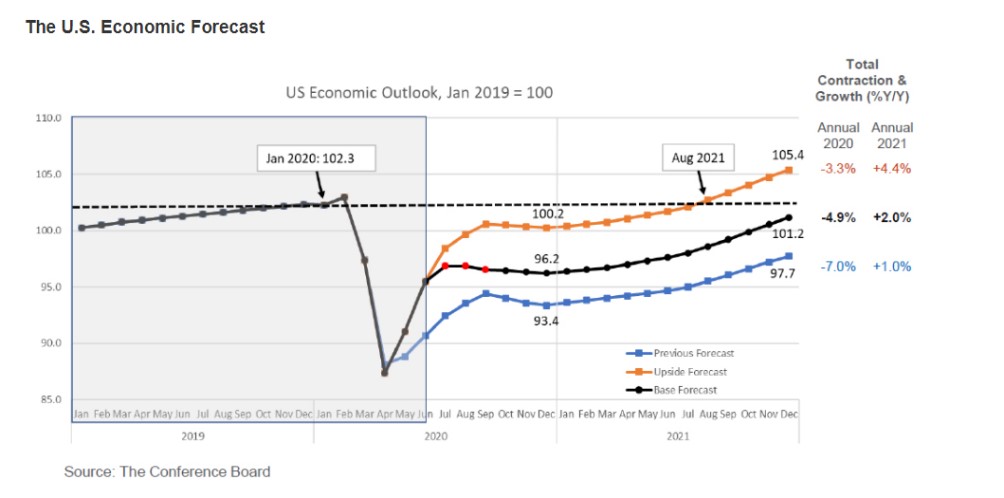
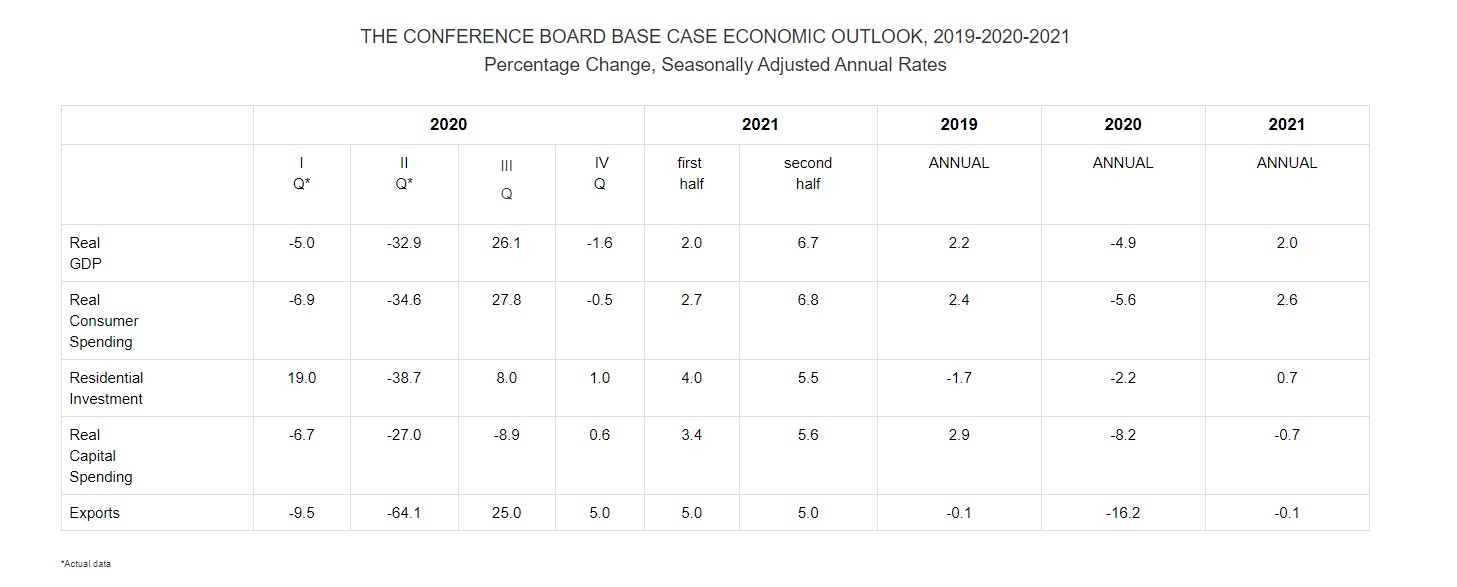
• Base Case Forecast: “Our base case forecast includes a third quarter GDP rebound of 26% and a fourth quarter GDP contraction of 1.6%, both annualized rates. Given the severity of the economic contraction in the second quarter, even a moderate improvement in economic activity over the summer yields strong growth rate in the third quarter. In our baseline forecast consumer spending is the largest driver of growth over the summer, but then stalls as high levels of unemployment damage spending later in the year. This yields an annual growth rate of -4.9% in 2020 and puts the U.S. economy on a path for about 2% growth in 2021. We do not expect a full recovery until early 2022.”
• Upside Forecast: “Alternatively, we offer a second more optimistic scenario in which the growth trend seen in May and June is sustained in July, August and September. Even if this is the case, we would still expect high unemployment rates, in the double digits, to damage consumer demand in the fourth quarter. This upside forecast results in an annual growth rate of -3.3% in 2020 and a rebound of 4.4% in 2021. In this scenario U.S. monthly economic output with completely recover by August 2021.”
Employment
Nonfarm payroll employment increased in 40 states and the District of Columbia, decreased in one state and was essentially unchanged in nine states during July, according to the U.S. Bureau of Labor Statistics.
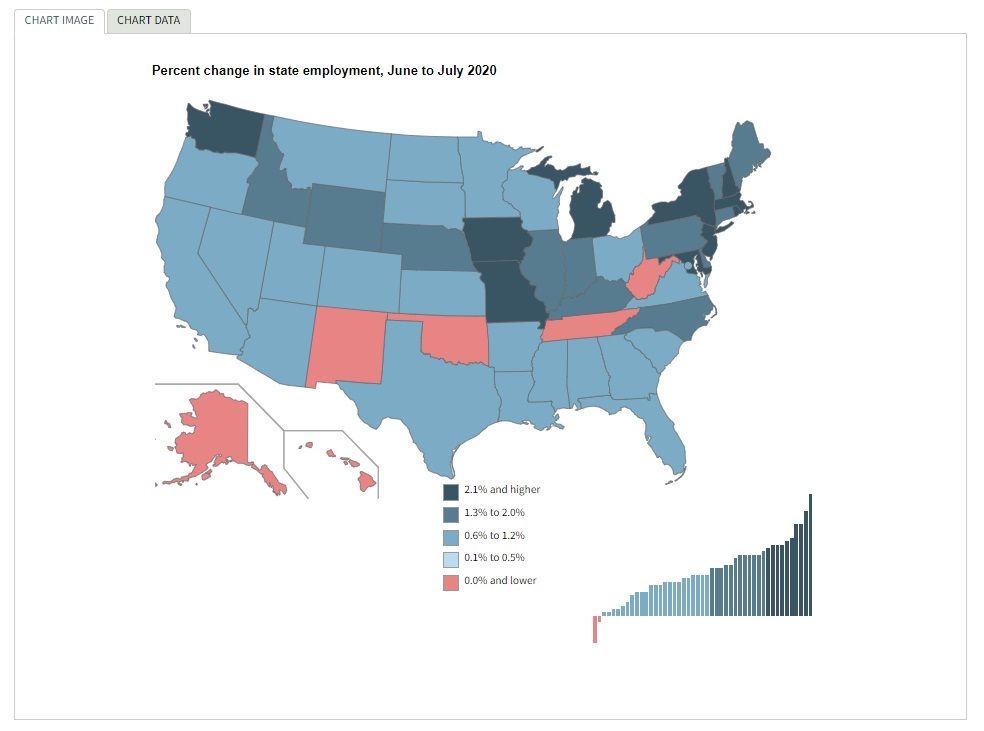
According to recent data from the Bureau, the largest job gains from June to July occurred in New York (+176,600), California (+140,400) and New Jersey (+129,900), while the largest percentage increases occurred in New Jersey (+3.6%), Rhode Island (+3.1%), as well as Michigan and Missouri (+2.7% each). Employment decreased in New Mexico (−6,000, or −0.8%).
In addition to job gains, real average hourly earnings (adjusted for inflation) increased 3.7% from July 2019 to July 2020, after increasing 4.1% over the year ending June 2020. “The recent large increases in hourly earnings reflect the substantial job loss among lower-paid workers as a result of the COVID-19 closures. The July increase in real earnings resulted from a 4.8% increase in average hourly earnings being partially offset by an increase of 1% in the Consumer Price Index for All Urban Consumers,” stated the U.S. Bureau of Labor Statistics.
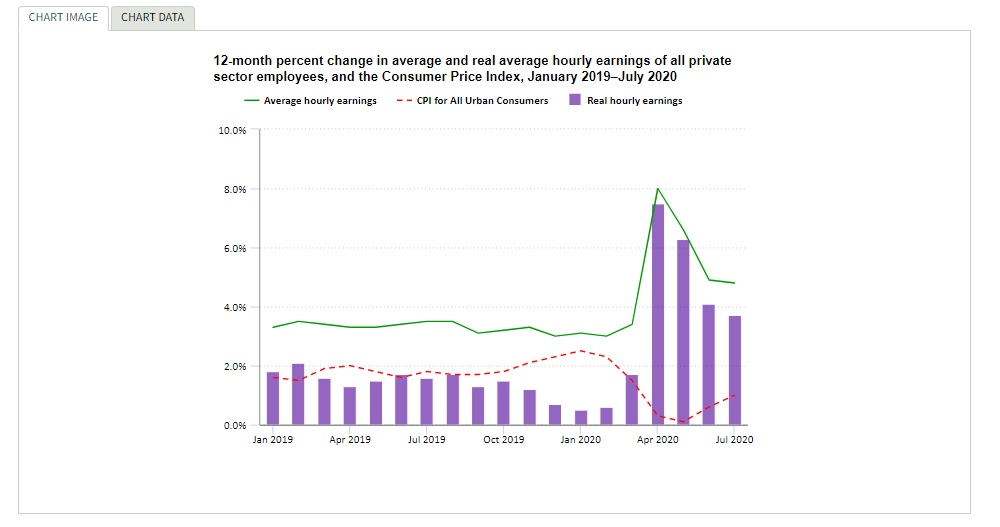
During 2019, the 12-month increase in real average hourly earnings ranged from 0.7% to 2.1%.
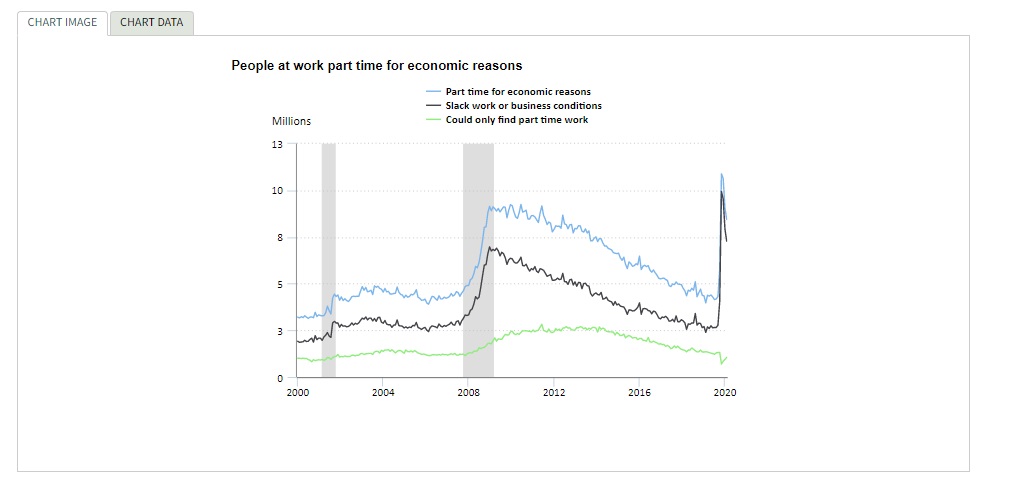
According to the U.S. Bureau of Labor Statistics, those at work part time for economic reasons, or involuntary part-time workers, totaled 8.4 million during July. This was a decrease of 619,000 people from the previous month, but 4.1 million higher than in February 2020. These individuals, who would have preferred full-time employment, were working part time because their hours had been reduced or they were unable to find full-time jobs. This group includes people who usually work full time and people who usually work part time.
By Demographic
Unemployment rates declined in July among major worker groups: adult men—9.4%, adult women—10.5%, teenagers—19.3%, Whites—9.2%, Asians—12%, Hispanics—12.9% and Blacks—14.6%.
By Industry
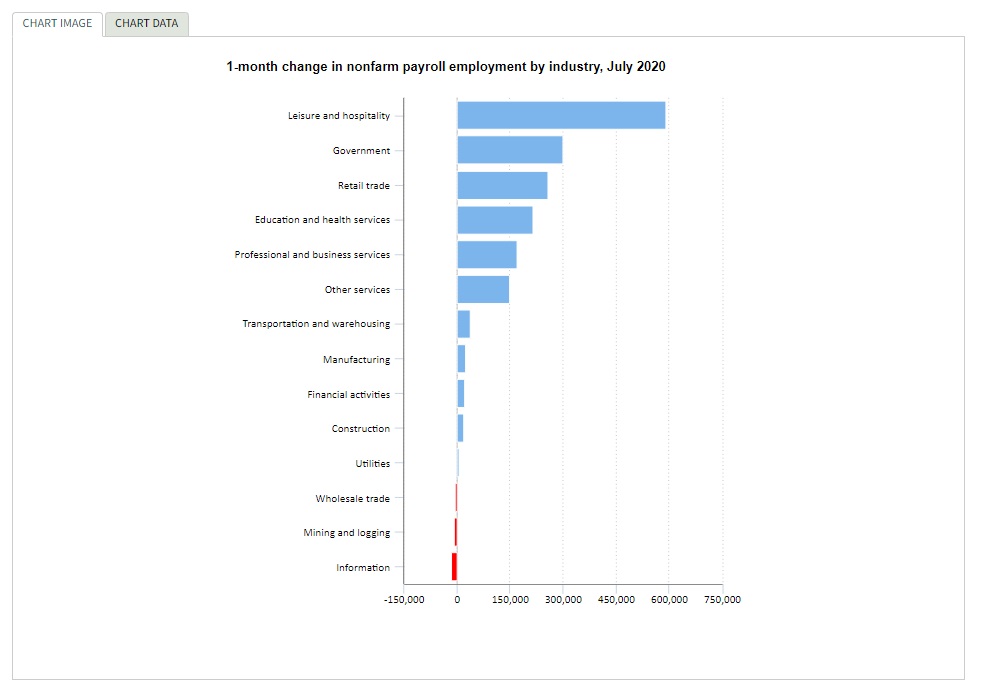
Total nonfarm payroll employment rose by 1.8 million in July. For comparison: less than the increases of 4.8 million in June and 2.7 million in May but lower than the February level by 12.9 million. The largest employment increases occurred in leisure and hospitality, government, retail trade, professional and business services, other services and health care. In particular, employment in leisure and hospitality was a bright spot (+592,000), accounting for approximately one-third of the gain in total nonfarm employment.
By location, nonfarm payroll employment increased across 40 states and the District of Columbia during July, with the largest job gains reported in New York (+176,600), California (+140,400) and New Jersey (+129,900). The largest percentage increases occurred in New Jersey (+3.6%), Rhode Island (+3.1%), as well as Michigan and Missouri (+2.7% each). Employment decreased in New Mexico (-6,000, or -0.8%).
Important takeaways, courtesy of the U.S. Bureau of Labor Statistics:
- Employment in food services and drinking places increased by 502,000, following gains of 2.9 million in May and June combined. Despite the gains over the last three months, employment in food services and drinking places is down by 2.6 million since February.
- Over the month, employment also rose in amusements, gambling and recreation (+100,000).
- Government employment increased by 301,000 but is 1.1 million below its February level.
- Typically, public-sector education employment declines in July (before seasonal adjustment). However, employment declines occurred earlier than usual this year due to the pandemic, resulting in unusually large July increases in local government education (+215,000) and state government education (+30,000) after seasonal adjustment. A July job gain in federal government (+27,000) reflected the hiring of temporary workers for the 2020 Census.
- Retail trade added 258,000 jobs. Employment in the industry is 913,000 lower than in February. Nearly half of the job gains in retail trade occurred in clothing and clothing accessories stores (+121,000). By contrast, the component of general merchandise stores that includes warehouse clubs and supercenters lost jobs (-64,000).
- Professional and business services increased (+170,000) but remains 1.6 million below its February level. The majority of gains occurred in temporary help services (+144,000).
- The other services industry added 149,000 jobs, with most of the increase occurring in personal and laundry services (+119,000). Since February, employment in other services is down by 627,000.
- Health care added 126,000 jobs, with employment growth in offices of dentists (+45,000), hospitals (+27,000), offices of physicians (+26,000) and home health care services (+16,000). Job losses continued in nursing and residential care facilities (-28,000). Employment in health care is down by 797,000 since February.
- Social assistance increased by 66,000, with child day care services accounting for most of the gain (+45,000). Employment in social assistance is 460,000 lower than in February.
- Transportation and warehousing rose by 38,000, following an increase of 87,000 in June. Despite job gains over the past two months, employment in the industry is down by 470,000 since a recent peak in January. Transit and ground passenger transportation (+20,000), air transportation (+16,000) and couriers and messengers (+9,000) added jobs as well.
- Manufacturing employment increased by 26,000. Motor vehicles and parts (+39,000) was partially offset by losses in fabricated metal products (-11,000), machinery (-7,000) and computer and electronic products (-6,000). Although manufacturing has added 623,000 jobs over the past three months, employment is 740,000 lower than in February.
- Financial activities added 21,000 jobs, with most of the gain in real estate and rental and leasing (+15,000). Since February, employment in financial activities is down by 216,000.
- Construction employment changed little (+20,000), following job gains of 619,000 in May and June combined. However, employment in the industry remains 444,000 below its February level.
- Mining continued to shed jobs (-7,000), reflecting a loss in support activities for mining (-11,000). Mining has lost 127,000 jobs since a recent peak in January 2019, although nearly three-fourths of this decline has occurred since February 2020.
By Geography
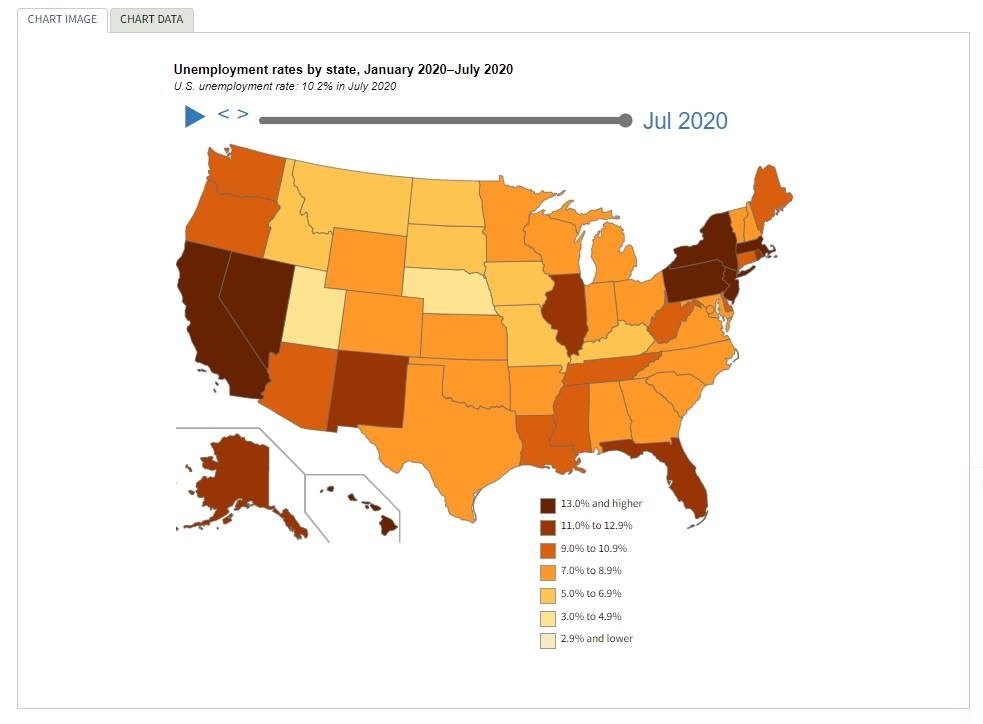
Unemployment rates, however, were lower in 30 states, higher in nine states and stable in 11 states and the District of Columbia during July, according to the U.S. Bureau of Labor Statistics. Unsurprisingly, all 50 states and the District had jobless rate increases compared to a year earlier.
Massachusetts recorded the highest unemployment rate in July—16.1%, followed by New York—15.9%. Rates in Connecticut (10.2%), New Mexico (12.7%) and New York (15.9%) set new series highs. Conversely, Utah reported the lowest unemployment rate—4.5%, followed by Nebraska—4.8% and Idaho—5%. In total, 28 states and the District of Columbia had jobless rates lower than the U.S. figure of 10.2%, 11 states had higher rates and 11 states had rates that were not appreciably different from that of the nation.
Furthermore, the largest unemployment rate decrease occurred in Michigan (-6.2 percentage points). Rates declined over the month by at least two percentage points in an additional six states. The largest over-the-month jobless rate increases occurred in New Mexico (+4.3 percentage points) and Maine (+3.2 points).
KPI — August: State of the Manufacturing Sector
Key Performance Indicators Report — August 2020


