KPI — August 21: State of the Economy

Throughout 2021, The Conference Board consistently revised its real GDP up to reflect significant forecasted growth. Citing generous government stimulus, pent-up consumer demand, a rise in consumer confidence, as well as increased vaccination rates, The Conference Board projected a 9% (annualized rate) boost in Q2 2021 and 6.6% (year-over-year).
However, according to an advance estimate released by the Commerce Department, the U.S. economy grew less than expected during those three months – posting a 6.5% annual rate during the second quarter. Additionally, first-quarter GDP was revised down to 6.3% from its previous reading of 6.4%.
Though real growth in the economy remains solid, said Bill Dunkelberg, NFIB chief economist. “Over 6% in real terms in Q2 is a historically high reading,” he explained.
For Paul Ashworth, chief U.S. economist at Capital Economics, the underperforming results point to different logic: a rash of government spending does not stimulate the economy, rather de-stimulates growth and causes inflation. While the Federal Reserve says price increases are temporary – reiterating they will fall as supply chain issues caused by COVID-19 are resolved – businesses and consumers are feeling the burn. Suppliers are battling unprecedented demand alongside labor and raw material shortages; freight and transit time increases; port congestion and shipping setbacks; as well as price adjustments and even factory shutdowns.
“The level of GDP has now exceeded the 2019 peal, although employment has not. Fewer workers are making more stuff,” Dunkelberg agreed.
Combined, the issues lift core personal consumption expenditures – the Federal Reserve’s preferred inflation measure – to 3.4% annual growth, the fastest since 1992. Furthermore, economists are sharply divided over whether the $1.2 trillion bipartisan infrastructure framework and proposed $3.5 trillion reconciliation bill will exacerbate inflation pressures that are already the most severe in decades.
Looking ahead, economists agree headwinds to the economy remain.
Employment
July job predictions ranged from 350,000 to 1.2 million. In the end, total nonfarm payroll employment increased by 943,000, following 850,000 in June, according to the U.S. Bureau of Labor Statistics. The national unemployment rate declined .5 percentage points to 5.4% – the lowest level since March 2020 and below market expectations of 5.7%, according to Trading Economics.
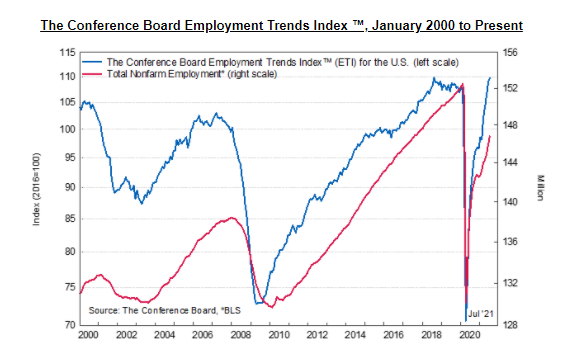
As such, The Conference Board Employment Trends Index™ (ETI) rose in July, the fifth consecutive monthly increase. The index now stands at 109.80, up from 108.96 (a downward revision) in June.
“The Employment Trends Index remained on its historically strong upward trajectory, suggesting rapid job growth is likely to continue over the next several months,” said Gad Levanon, head of The Conference Board Labor Markets Institute. “This high mark comes off the back of nearly one million new jobs added in both June and July and a steep decline in the unemployment rate,” he continued.
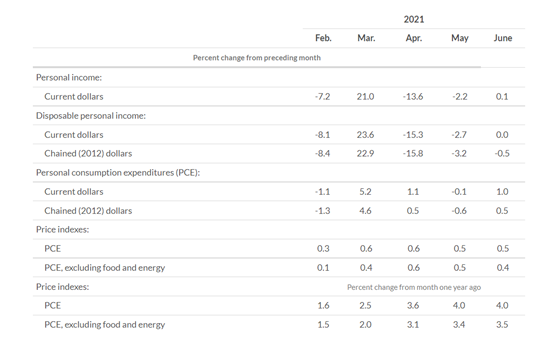
According to the U.S. Bureau of Economic Analysis (BEA), the increase in personal income in June primarily reflected an increase in compensation of employees. The $155.4 billion increase in current dollar PCE reflected an increase of $29.3 billion in spending for goods and a $126.1 billion increase in spending for services. Personal outlays increased $158.7 billion. Personal saving was $1.70 trillion and the personal saving rate – personal saving as a percentage of disposable personal income – was 9.4%. The PCE price index increased 4% year-over-year, reflecting increases in both goods and services. Energy prices increased 24.2%, while food prices increased .9%. Excluding food and energy, the PCE price index increased 3.5% year-over-year.
Important Takeaways, Courtesy of the Bureau of Labor Statistics:
- Among the unemployed, the number of job leavers – that is, unemployed persons who quit or voluntarily left their previous job and began looking for new employment – increased by 164,000 to 942,000 in June; an update of this data point appears to be missing from the current July report.
- The number of persons on temporary layoff fell by 572,000 to 1.2 million in July. This measure is down considerably from the high of 18 million in April 2020 but is 489,000 above pre-pandemic levels.
- The number of permanent job losers declined by 257,000 to 2.9 million but is 1.6 million higher than pre-pandemic levels.
- The number of long-term unemployed (those jobless for 27 weeks or more) decreased by 560,000 to 3.4 million but is 2.3 million higher than in February 2020. These long-term unemployed accounted for 39.3% of the total unemployed in July.
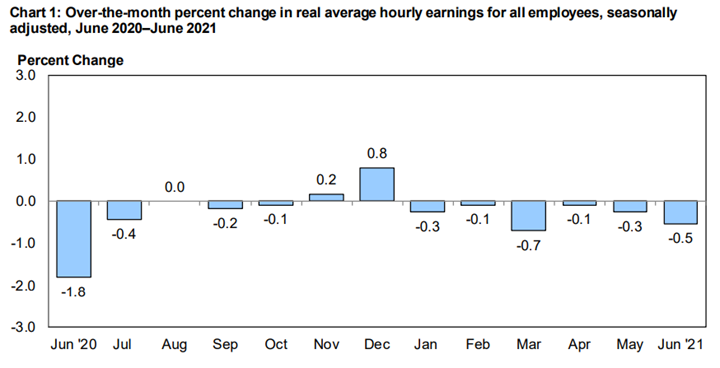
Real average hourly earnings for all employees decreased .5% from May to June (seasonally adjusted), according to the U.S. Bureau of Labor Statistics. This result stems from an increase of .3% in average hourly earnings combined with an increase of .9% in the Consumer Price Index for All Urban Consumers (CPI-U). Real average weekly earnings decreased .9% over the month due to the change in real average hourly earnings combined with a decrease of .3% in the average workweek.
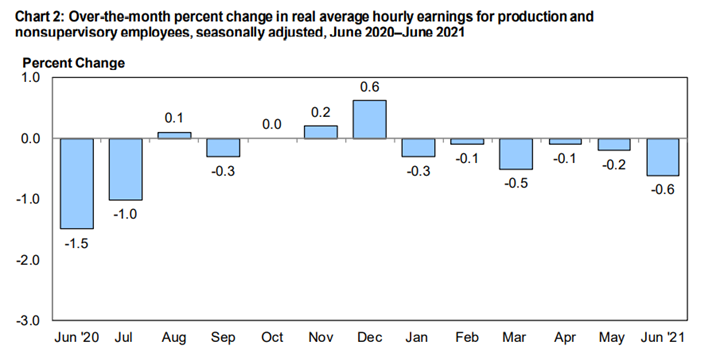
Real average hourly earnings decreased 1.7% (seasonally adjusted) from June 2020 to June 2021. The change in real average hourly earnings combined with an increase of .3% in the average workweek resulted in a 1.4% decrease in real average weekly earnings over this period.
By Demographic
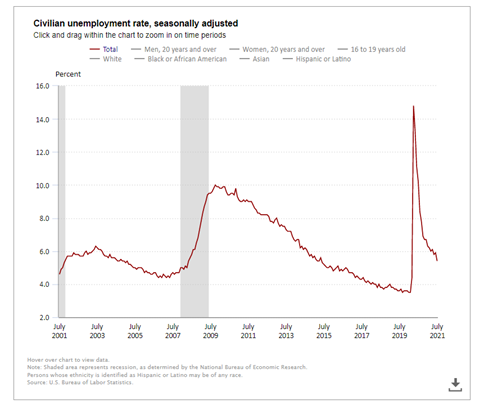
Unemployment rates among all major worker groups in July: adult women – 5%, adult men – 5.4%, teenagers – 9.6%, Whites – 4.8%, Asians – 5.3%, Hispanics – 6.6% and Blacks – 8.2%.
By Industry
Nonfarm payroll employment in July is up by 16.7 million since April 2020 but remains down by 5.7 million, or 3.7%, compared to its pre-pandemic level in February 2020. Notable job gains occurred in leisure and hospitality, local government education, as well as professional and business services.
Important Takeaways, Courtesy of the U.S. Bureau of Labor Statistics:
- Employment in leisure and hospitality increased by 380,000. Two-thirds of the job gain was in food services and drinking places (+253,000). Employment also increased in accommodation (+74,000) and arts, entertainment and recreation (+53,000). Despite recent growth, employment in leisure and hospitality is down by 1.7 million, or 10.3%, from its pre-pandemic level in February 2020.
- Transportation and warehousing added 50,000 jobs. Job growth occurred in transit and ground passenger transportation (+19,000), warehousing and storage (+11,000) and couriers and messengers (+8,000). Employment in transportation and warehousing has grown by 534,000 since April 2020; the industry has recovered 92.9% of the jobs lost during the February-April 2020 recession(-575,000).
- Employment in manufacturing increased by 27,000, largely in durable goods manufacturing. Within durable goods, job gains occurred in machinery (+7,000) and miscellaneous durable goods manufacturing (+6,000). Manufacturing employment is 433,000 below its February 2020 level.
- Employment in mining increased by 7,000 in July, reflecting a gain in support activities for mining (+6,000). Mining employment has risen by 49,000 since a trough in August 2020 but is 103,000 below a peak in January 2019.
- Employment in retail trade changed little in July (-6,000), following large increases in the prior two months. Job gains in gasoline stations (+14,000), miscellaneous store retailers (+7,000) and non-store retailers (+5,000) were more than offset by a loss in building material and garden supply stores (-34,000). Since February 2020, employment in retail trade is down by 270,000.
- Employment showed little change in construction and wholesale trade.
KPI — August 2021: Consumer Trends
Key Performance Indicators Report — August 2021


