KPI — August 2023: State of Business

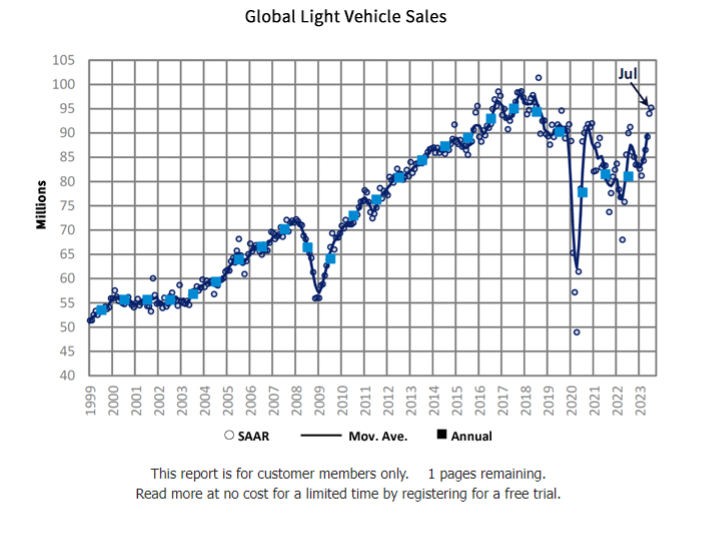
GlobalData reports the global light vehicle (LV) selling rate increased steadily from 89 mn units/year in May to 93 mn units/year in June and 95 mn units/year in July. Despite continued growth, global light vehicle sales posted a moderate 5.5% year-over-year increase in July.
While the U.S. and Western and Eastern Europe registered double digit year-over-year growth, China and Korea both experienced declines – largely due to comparatively strong levels in 2022, as well as the additional excise duty finally being implemented in Korea. With reduced consumer spending in China, several automakers have slashed prices to help stimulate demand in the region.
“The global outlook for 2023 is largely in line with last month, but volume is up 100,000 units to 86.4 million, or 7% higher than 2022,” says Jeff Schuster, group head and executive vice president of automotive at GlobalData. “The auto industry continues to walk a tightrope through the various risks in the industry, including the economy, disruption and pricing pressures on consumers. However, demand remains robust and inventory levels are rising, which have kept the industry with a positive health outlook into 2024. The forecast for global light vehicles in 2024 is stable at 90.2 million units.”
State of Manufacturing
Economic activity in the manufacturing sector contracted for the ninth consecutive month following a 28-month period of growth, according to the nation’s supply executives in the latest Manufacturing ISM® Report On Business®. The July Manufacturing PMI® registered 46.4%, 0.4 percentage point higher than June.
“The U.S. manufacturing sector shrank again, but the uptick in the PMI® indicates a marginally slower rate of contraction. The July composite index reading reflects companies continuing to manage outputs down as order softness continues,” says Timothy R. Fiore, CPSM, C.P.M., chair of the Institute for Supply Management® (ISM®) Manufacturing Business Survey Committee.
Important takeaways, Courtesy of the Manufacturing ISM® Report On Business®:
- Demand eased again, with the (1) New Orders Index contracting – though at a slower rate, (2) New Export Orders Index moving deeper into contraction and (3) Backlog of Orders Index improving compared to June but remaining at a low level.
- The Customers’ Inventories Index reading indicated appropriate buyer/supplier tension, which is neutral to slightly positive for future production.
- Output/Consumption (measured by the Production and Employment indexes) was negative, with a combined 2.1-percentage point downward impact on the Manufacturing PMI® calculation. Panelists have “mixed sentiment” about when significant growth will return. As such, many have reduced production and continue to keep head counts down, to a greater extent than in previous months.
- Inputs – defined as supplier deliveries, inventories, prices and imports – continued to accommodate future demand growth.
- The Supplier Deliveries Index again indicated faster deliveries, while the Inventories Index remained in contraction territory as panelists’ companies continued to try and mitigate inventories exposure.
- The Prices Index remained in “decreasing” territory, at a level generally not seen since early in the coronavirus pandemic (a reading of 40.8% in May 2020). Manufacturing lead times sentiment improved but remain at elevated levels.
U.S. New Vehicle Sales
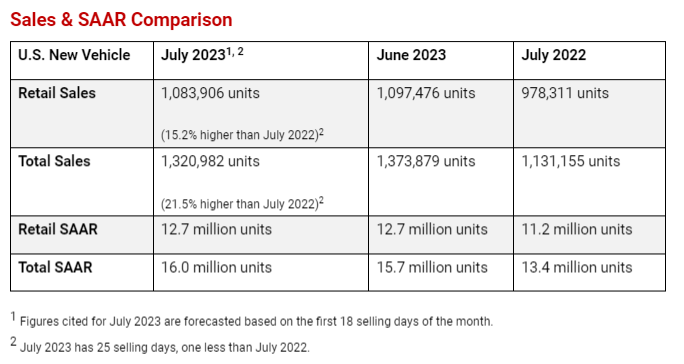
Total new-vehicle sales in July, including retail and non-retail transactions, are projected to reach 1,320,982 units – a 21.5% year-over-year increase, according to a joint forecast from J.D. Power and GlobalData.
“July continues the prevailing theme of robust sales growth thus far in 2023, facilitated by amplified vehicle production and pent-up consumer demand,” says Thomas King, president of the data and analytics division at J.D. Power.
King says that sales to fleet customers are still relatively elevated, as manufacturers leverage higher vehicle production to allocate more vehicles to those fleet customers. Fleet sales are projected to increase 55.1% year-over-year.
Important Takeaways, Courtesy of J.D. Power:
- Retail buyers are projected to spend $46.3 billion on new vehicles, up $2.7 billion year-over-year.
- Truck/SUVs are on pace to account for 77.9% of new vehicle retail sales.
- The average new vehicle retail transaction price is expected to reach $45,305 – down $866 year-over-year.
- Average incentive spending per unit is anticipated to reach $1,888 – up from $977 last year. Spending as a percentage of the average MSRP is expected to increase to 3.7%, up 1.7 percentage points from July 2022.
- Average interest rates for new-vehicle loans are expected to increase to 7.1%, 180 basis points higher than a year ago.
- Fleet sales are estimated to total 237,076 units in July, up 61.3% year-over-year on a selling day adjusted basis. Fleet volume is expected to account for 17.9% of total light-vehicle sales, up from 13.5% a year ago.
- The total retailer profit per unit, which includes grosses, finance and insurance income, is expected to reach $3,533 in July. While this is 28.3% lower than a year ago, it is still more than double the amount in 2019.
“In the latter half of 2023, the industry could face a series of challenges, yet remains poised to navigate through them,” King says. “Despite the potential effect of prevailing macro-economic risks, the industry is ready to capitalize on the prevailing pent-up demand for new vehicles, in conjunction with incremental enhancements in historically low inventory levels. As the availability of new vehicles improves, a gradual easing of pricing and per unit profitability is anticipated but will be mitigated by higher sales volumes.”
U.S. Used Market
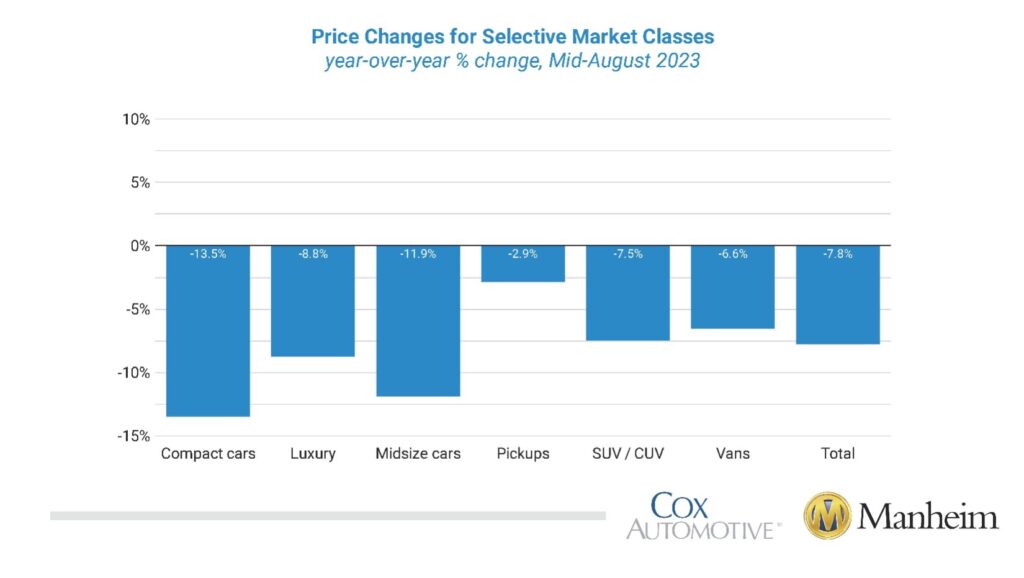
Wholesale used-vehicle prices (on a mix-, mileage- and seasonally adjusted basis) increased 0.1% from July in the first 15 days of August. The mid-month Manheim Used Vehicle Value Index rose to 212.0, which was down 7.8% from the full month of August 2022.
According to Manheim, all major market segments posted seasonally-adjusted prices that were lower year-over-year in the first half of August. Pickups, sports cars, vans and SUVs decreased less than the industry in seasonally-adjusted prices, at -2.9%, -4.6%, -6.6% and -7.5%, respectively. On trend, compact cars declined the most, at 13.5%, followed by midsize cars (-11.9%) and luxury (-8.8%).
Used-vehicle prices declined slightly from a year ago but remain close to all-time highs. JD Power says the current average trade-in equity is approximately $9,033, down $1,014 year-over-year. For context, trade equity this month is still more than double the pre-pandemic level, helping owners offset some of the pricing and interest rate increases.
KPI — August 2023: Recent Vehicle Recalls
Key Performance Indicators Report — August 2023