KPI — April 2022: State of the Economy

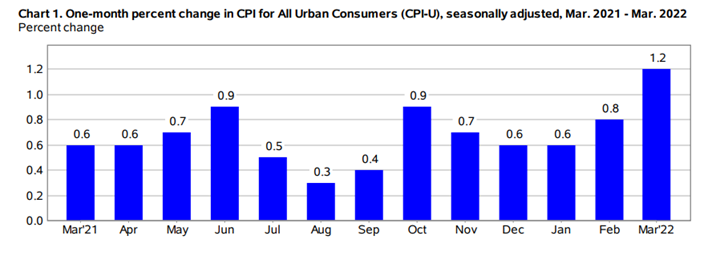
The Consumer Price Index for All Urban Consumers (CPI-U) increased 1.2% in March on a seasonally adjusted basis after rising .8% in February, according to the U.S. Bureau of Labor Statistics. Over the last 12 months, the all-items index increased 8.5% before seasonal adjustment – the largest increase since 1981.
Increases in the indexes for gasoline, shelter and food were among the largest contributors to the seasonally adjusted all-items increase. In fact, the gasoline index rose 18.3% in March, accounting for more than half of the all-items monthly increase. Other energy component indexes also increased. The food index rose 1% and the food-at-home index rose 1.5%, with the largest increases in cereal and bakery products (10%), poultry, fish and meat (13.8%), fresh fruits and vegetables (8.1%) and eggs (11.2%).
The index for all items less food and energy rose .3% in March following a .5% increase the prior month. In addition, the shelter index was by far the biggest factor in the increase, with a broad set of other indexes also contributing, including airline fares, household furnishings and operations, medical care and motor vehicle insurance. In contrast, the index for used cars and trucks fell 3.8% month-over-month.
The all-items index less food and energy index rose 6.5%, the largest 12-month change since 1982. The energy index rose 32% year-over-year while the food index increased 8.8%, the largest 12-month increase since 1981.

The White House blames supply-chain bottlenecks and pandemic-induced disruptions in the economy, while others point to government spending and energy policies targeting the oil and gas industries.
“When will this end? It is a disservice to the American people to act as if inflation is a new phenomenon. The Federal Reserve and the administration failed to act fast enough, and today’s data is a snapshot in time of the consequences being felt across the country,” says West Virginia Senator, Joe Manchin (D). “Instead of acting boldly, our elected leaders and the Federal Reserve continue to respond with half-measures and rhetorical failures searching for where to lay the blame. The American people deserve the truth about why record inflation is happening and what must be done to control it.”
“Here is the truth: we cannot spend our way to a balanced, healthy economy and continue adding to our $30 trillion national debt,” he adds. “Getting inflation under control will require more aggressive action by a Federal Reserve that waited too long to act. It demands the administration and Congress – Democrats and Republicans alike – support an all-the-above energy policy because that is the only way to bring down the high price of gas and energy while attacking climate change.”
The biggest question becomes if central bank officials can successfully tame inflation and stabilize prices without triggering an economic recession.
Employment
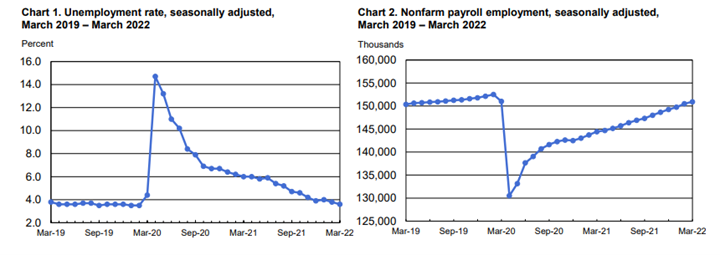
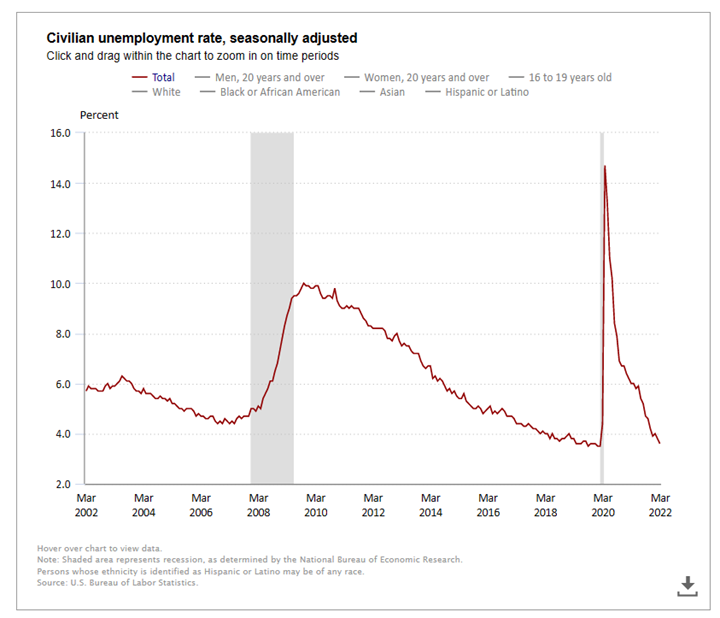
Total nonfarm payroll employment rose by 431,000 in March and the unemployment rate declined to 3.6%, short of economists’ predictions at 490,000.
“The job market feels like it’s rip-roaring,” says Mark Zandi, chief economist at Moody’s Analytics. “The job market is a machine. It’s been turning over a half-million, give or take for a year… We can’t maintain this pace for very long or else we’re going to overheat.”

Important Takeaways, Courtesy of the Bureau of Labor Statistics:

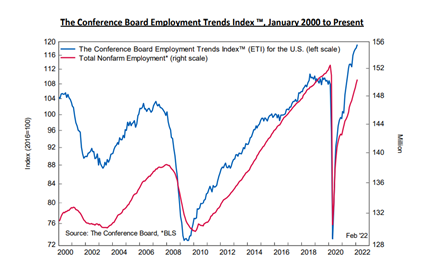
The Conference Board Employment Trends Index™ (ETI) increased in March to 120.56, up from 118.90 in February 2022 (a downward revision).
- The number of persons on temporary layoff changed little month-over-month at 787,000 and has essentially returned to its February 2020 level.
- Among the unemployed, the number of permanent job losers decreased by 191,000 to 1.4 million in March and is close to the February 2020 level of 1.3 million.
- The number of long-term unemployed (those jobless for 27 weeks or more) decreased by 274,000 to 1.4 million. This measure is 307,000 higher than in February 2020. The long-term unemployed accounted for 23.9% of all unemployed persons in March.
By Demographic
Unemployment rates among the major worker groups: adult women – 3.3%; adult men – 3.4%; teenagers – 10%; Asian – 2.8%; White – 3.2%; Hispanic – 4.2% and Black – 6.2%.

By Industry
Total nonfarm payroll employment rose by 431,000 in March, as job gains continued in leisure and hospitality, professional and business services, retail trade and manufacturing. Overall, job growth averaged 562,000 per month in the first quarter of 2022, the same as the average monthly gain for 2021. However, employment is down by 1.6 million, or 1%, from its pre-pandemic level in February 2020.
Important takeaways, courtesy of the U.S. Bureau of Labor Statistics:
- Employment in leisure and hospitality increased 112,000 in March. Job growth occurred in food services and drinking places (+61,000), as well as accommodation (+25,000). Employment in leisure and hospitality remains down by 1.5 million, or 8.7%, since February 2020.
- Job growth continued in professional and business services, which added 102,000 jobs. Within the industry, job gains occurred in services to buildings and dwellings (+22,000), accounting and bookkeeping services (+18,000), management and technical consulting services (+15,000), computer systems design and related services (+12,000), as well as scientific research and development services (+5,000). Employment in professional and business services is 723,000 higher than in February 2020.
- Employment in retail trade increased by 49,000, with gains in general merchandise stores (+20,000) and food and beverage stores (+18,000). Health and personal care stores lost 5,000 jobs. Retail trade employment is 278,000 above its level in February 2020.
- Manufacturing added 38,000 jobs. Employment in durable goods industries rose by 22,000, with gains in transportation equipment (+11,000) and electrical equipment and appliances (+4,000). These gains were partially offset by a loss of 5,000 jobs in nonmetallic mineral products. Nondurable goods manufacturing added 16,000 jobs over the month, including a gain in chemicals (+7,000). Since February 2020, manufacturing employment is down by 128,000, or 1%.
- Employment in construction continued to trend up in March (+19,000) and has returned to its February 2020 level.
Review all employment statistics here.

KPI — April 2022: Consumer Trends
Key Performance Indicators Report — April 2022
