KPI — April 2022: Consumer Trends
The Conference Board Consumer Confidence Index® increased slightly in March, after a tumble in February. The Index now stands at 107.2 (1985=100), up from 105.7 in February. The Present Situation Index – based on consumers’ assessment of current business and labor market conditions – improved to 153.0 from 143.0 last month. However, the Expectations Index – based on consumers’ short-term outlook for income, business and labor market conditions – declined to 76.6 from 80.8.
“The Present Situation Index rose substantially, suggesting economic growth continued into late Q1. Expectations, on the other hand, weakened further with consumers citing rising prices, especially at the gas pump, and the war in Ukraine as factors,” says Lynn Franco, senior director of economic indicators at The Conference Board.
Meanwhile, she says purchasing intentions for big-ticket items like automobiles softened over the past few months as expectations for interest rates have risen.
“Nevertheless, consumer confidence continues to be supported by strong employment growth, thus holding up remarkably well despite geopolitical uncertainties and expectations for inflation over the next 12 months,” says Franco. “However, these headwinds are expected to persist in the short term and may potentially dampen confidence, as well as cool spending further in the months ahead.”
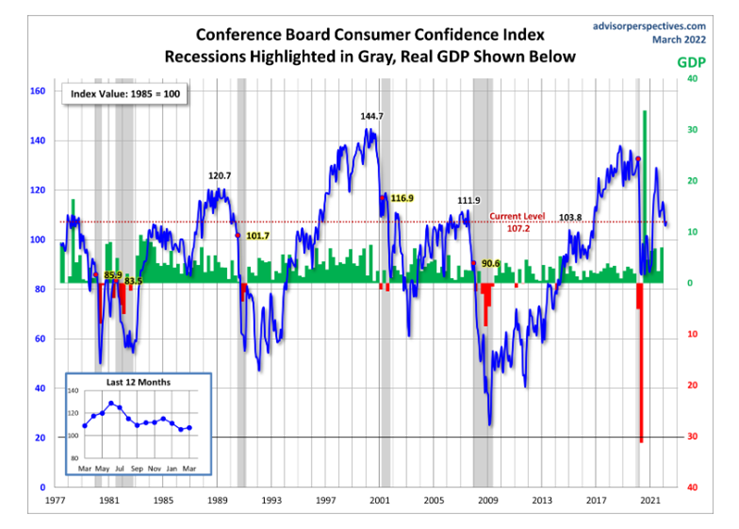
The chart evaluates the historical context for this index as a coincident indicator of the economy. Toward this end, Advisor Perspectives highlighted recessions and included GDP. The regression through the index data shows the long-term trend and highlights the extreme volatility of this indicator. Statisticians may assign little significance to a regression through this sort of data; however, the slope resembles the regression trend for real GDP shown below, and it is a more revealing gauge of relative confidence than the 1985 level of 100 that the Conference Board cites as a point of reference.
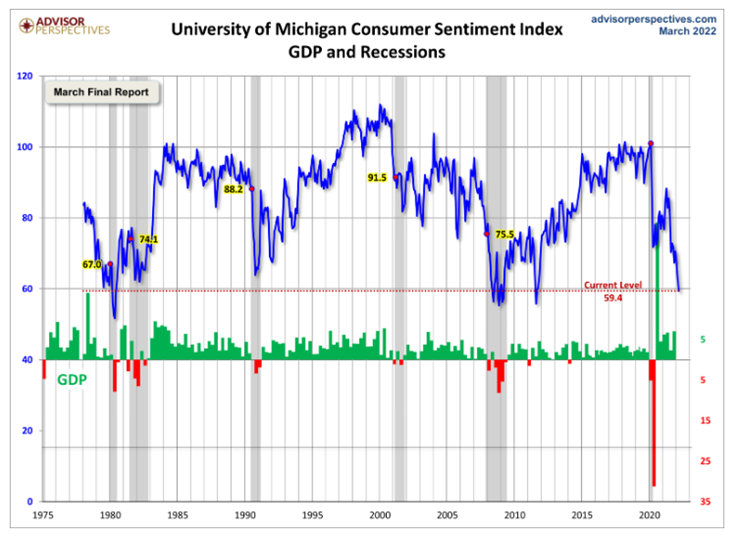
The Consumer Sentiment Index – a survey consisting of approximately 50 core questions covering consumers’ assessments of their personal financial situation, buying attitudes and overall economic conditions – decreased to 59.4 in March from 62.8 in February and 67.2 in January, but is trending up 10.6% in early April, according to the University of Michigan Survey of Consumers.
Chief Economist Richard Curtin says nearly the entire gain was in the Expectations Index, which posted a monthly gain of 18%, including a leap of 29.4% in the year-ahead outlook for the economy and a 17.2% jump in personal financial expectations.
A strong labor market bolstered wage expectations 5.3% among consumers under age 45, the largest expected gain in more than three decades. Consumers still anticipate that the national unemployment rate will inch downward, acting to improve consumers’ outlook for the national economy.
“Nonetheless, the April survey offers only tentative evidence of small gains in sentiment, which is still too close to recession lows to be reassuring,” affirms Curtin. “There are still significant sources of economic uncertainty that could easily reverse the April gains, including the impact on the domestic economy from Putin’s war, and the potential impact of new COVID variants.”
Consumer Income & Spending
According to the U.S. Bureau of Economic Analysis (BEA), personal income increased $101.5 billion (.5%), disposable personal income (DPI) increased $76.1 billion (.4%) and personal consumption expenditures (PCE) increased $34.9 billion (.2%) in February 2022.
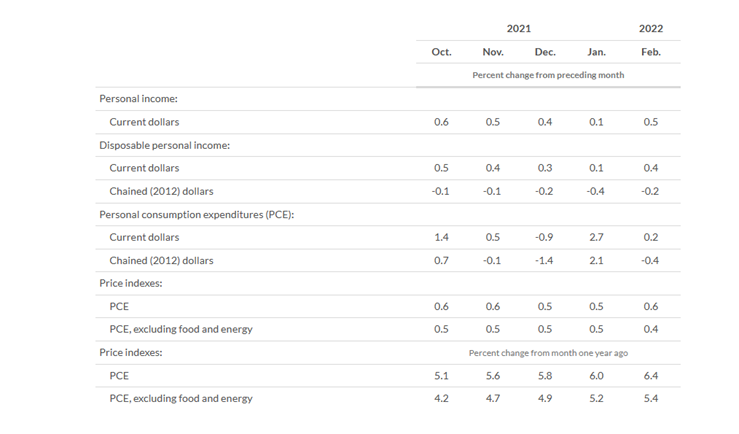
The increase in personal income primarily reflected an increase in compensation, which was partly offset by a decrease in government social benefits, explains BEA. Within compensation, the incline reflected increases in both private and government wages and salaries. As it relates to government social benefits, a decrease in “other” benefits was partly offset by increases in Medicare and Medicaid. Within “other” benefits, the decrease primarily reflected a decline in the Provider Relief Fund, as well as a decrease in Supplemental Nutrition Assistance Program benefits.
Important Takeaways, Courtesy of BEA:
- The $34.9 billion increase in current-dollar PCE reflected an increase of $93.8 billion in spending for services, which was partly offset by a $58.9 billion decrease in spending for goods.
- Spending for food services and accommodations were the largest contributor to the increase in services.
- Spending on motor vehicles and parts was the leading contributor to the decrease in goods.
- Personal outlays increased $37.3 billion. Personal saving was $1.15 trillion and the personal saving rate –personal saving as a percentage of disposable personal income – was 6.3%.
- The PCE price index increased 6.4% year-over-year in February, reflecting increases in both goods and services. Energy prices increased 25.7%, while food prices increased 8%. Excluding food and energy, the PCE price index increased 5.4% year over year.
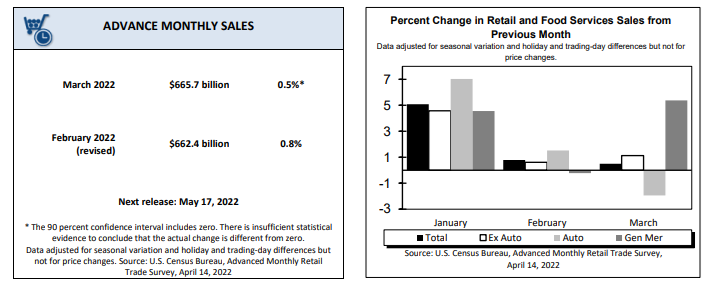
According to the U.S. Census Bureau, advance estimates of U.S. retail and food services sales for March 2022 – adjusted for seasonal variation plus holiday and trading-day differences but not for price changes – were $665.7 billion, an increase of .5% (±0.5%)* month-over-month and up 6.9% (±0.9%) year-over-year. Total sales for the January 2022 through March 2022 period were up 12.9% (±0.7%) year-over-year. The January 2022 to February 2022 percent change was revised to up .8% (±0.2%).
Retail trade sales increased .4% (±0.4%)* month-over-month 5.5% (±.7%) year-over-year. Gasoline stations were up 37% (±1.8%) year-over-year, while food services and drinking places were up 19.4% (±4.6%).
Key Performance Indicators Report — April 2022


