- KPI – September 2026: State of Manufacturing
- KPI – September 2026: State of Business – Automotive Industry
- KPI – September 2026: State of the Economy
- KPI – September 2026: Consumer Trends
- KPI – September 2026: Recent Vehicle Recalls
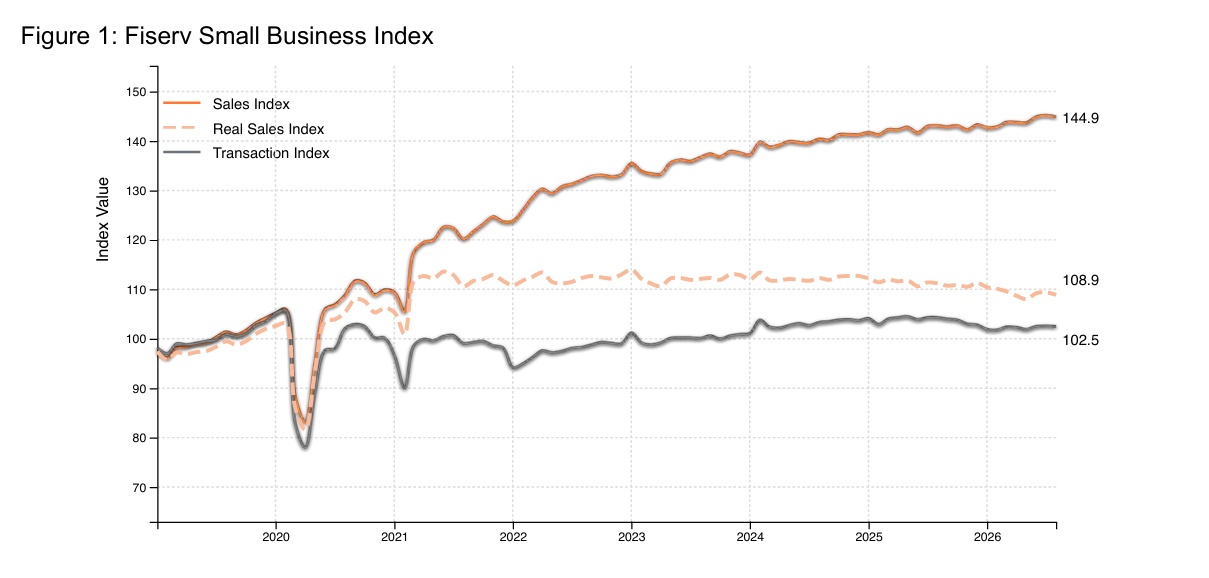
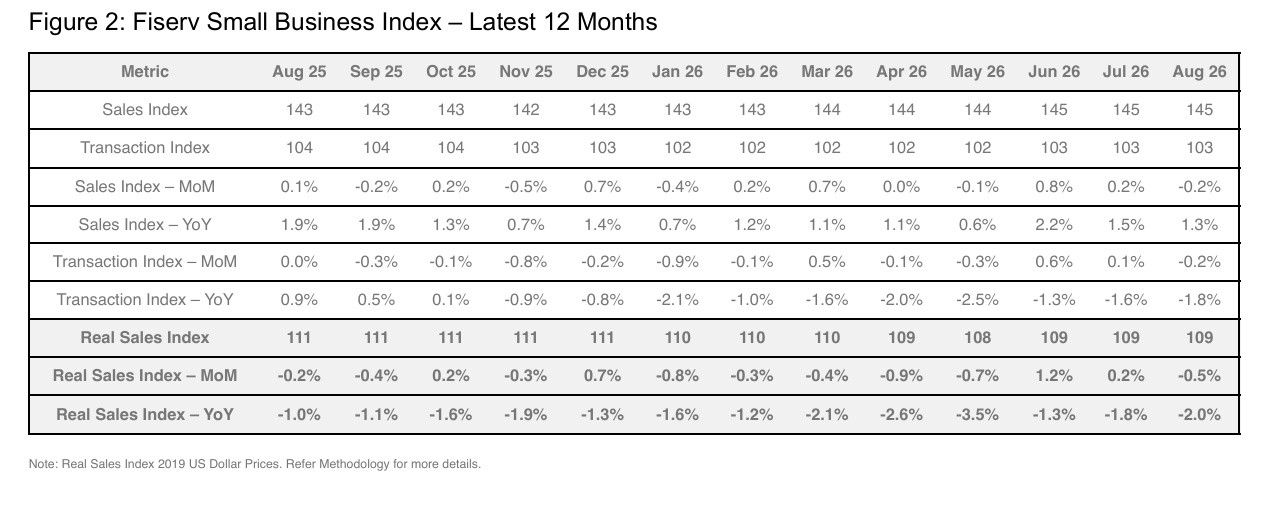
In August, the national Fiserv Small Business Index stood at 144.9, reflecting year-over-year (YoY) growth of 1.3% and a month-over-month (MoM) decline of 0.2%. Similarly, the Fiserv Small Business Transaction Index registered 102.5, showing a YoY and MoM decline of 1.8% and 0.2%, respectively.
According to the report, these results indicate a mixed performance, with modest annual growth in sales but a drop in transaction activity, suggesting potential shifts in consumer behavior or spending patterns. The Real Fiserv Small Business Index, adjusted for inflation, was 108.9 in August 2026. The YoY figures declined by 2% and 0.5% MoM.
“For many small business categories, August reinforces a trend we’ve seen throughout much of the year: consumers are still spending, but they’re making fewer trips and becoming more deliberate with their purchases,” says Prasanna Dhore, chief data officer at Fiserv. “With traffic declining and households continuing to prioritize value, each customer visit matters more for small businesses.”
Key Takeaways, Courtesy of The Fiserv Small Business Sales Index:
- Foot traffic pressure persists across Restaurants: Restaurant spending remained largely flat as fewer visits weighed on growth. Food Services and Drinking Places sales fell 0.3% YoY but grew 0.3% compared to July. Average tickets rose 2.6% YoY, while transactions fell 2.9%. Limited-Service Restaurants saw the steepest decline, with sales down 2.5% YoY as transactions fell 4.2%. Full-Service Restaurants performed better, with sales up 0.9% YoY as visits declined only 0.7%.
- Gasoline sales climbed while grocery sales slipped: Gas Station sales rose 15.1% YoY and 1.4% MoM. Average tickets rose 16.3% YoY, as oil markets continued to react to geopolitical pressures. Transactions fell 1.2% YoY, a signal that consumers are filling up less often. Food and Beverage Retailer sales softened, with sales down 1.4% YoY and 1.1% MoM. Lower demand and value-seeking pushed average grocery tickets down 1.2% YoY.
- Retail growth slowed: Total Retail sales rose 0.6% YoY, as foot traffic grew 0.7%. However, momentum was challenged MoM, with sales dropping 0.8% and foot traffic declining 0.6%. Despite inflation pressures, average tickets remained nearly flat across Retail this year, suggesting that consumers continue to seek value and manage spending. Gasoline Stations and Building Materials were the only Retail subsectors with growth over July, while YoY growth was broadly achieved across many Retail categories.
- Essentials again outpaced discretionary spending: Essentials grew 1.8% YoY, about twice the 0.9% growth in Discretionary spending. This was largely due to foot traffic erosion from Discretionary categories (-2% YoY) at twice the pace of essentials (-1%). Average tickets were up evenly across both areas. Goods and Services each grew 1.3% YoY but for different reasons. Goods growth came primarily from foot traffic growth of 0.7%, while Services leaned entirely on higher prices. Average tickets for Services grew 3.9%, while transactions fell 2.7%.
In August, the NFIB Small Business Optimism Index declined to 98.7—1.1 points below July’s highest level since August 2025 and above the 52-year average of 98.0.
“Uncertainty remains elevated among small business owners as they face a mixed set of challenges with weakened sales, supply chain disruptions and inflation pressures,” says Bill Dunkelberg, chief economist at NFIB. “While expectations for the overall economy dimmed, Main Street owners remain largely positive in the health of their own businesses.”
Important Takeaways, Courtesy of NFIB:
- Reports of “labor quality or availability” and “labor costs” as owners’ single most important problem eased in August, with “labor costs” dropping to its lowest level since March 2021. However, labor quality or availability in particular remains far above its long-term average.
- Expectations for better business conditions deteriorated five points to a net 10% (seasonally adjusted) but remain above the average of net 4%.
- When asked to evaluate the overall health of their business, 11% of owners rated it as excellent (down three points), 57% as good (up two points), 28% as fair (up two points) and 3% as poor (down one point).
- Actual sales worsened in August, with a seasonally adjusted net negative 9% of owners reporting higher nominal sales in the past three months, down five points from July and the lowest reading since November 2025.
- Reports of inflation as the single most important problem increased two points in August to 16%, now tying with taxes as the second top small business issue.
- The net percent of owners expecting easier credit conditions rose two points from July to a seasonally adjusted net negative 2%, the highest level since December 2024.
- Sixty-two percent of small business owners reported that supply chain disruptions affected their business to some extent, down one point from July.
Key Performance Indicator Report Overview
Professionals in the automotive, RV and powersports industries remain steadfast in their efforts to evolve their business models and grow their brands in the face of adversity. As such, the monthly Key Performance Indicator Report serves as an objective wellness check on the overall health of our nation, from the state of manufacturing and vehicle sales to current economic conditions and consumer trends. Below are a few key data points explained in further detail throughout the report.
Key Takeaways:
- In August, economic activity in the manufacturing sector expanded for the eighth consecutive month, according to the nation’s supply executives in the latest ISM Manufacturing PMI Report. The Manufacturing PMI registered 54.6%, one percentage point below the July figure of 55.6%. The overall economy continued in expansion for the 22nd month in a row.
- Global light vehicle sales increased to over 91 million units per year. Year-to-date sales stand at 57 million units—down 4% compared to the first eight months of 2025.
- Total new-vehicle sales for September 2026, including retail and non-retail transactions, are projected to reach 1,330,100—a 2.6% increase year-over-year, according to a joint forecast from J.D. Power and GlobalData.
- The Manheim Used Vehicle Value Index (MUVVI) fell to 206.2, reflecting a 1% decrease in wholesale used-vehicle prices (adjusted for mix, mileage and seasonality) in the first 15 days of September compared to August. The Manheim index was down 0.4% compared to September 2025, “softening” from the elevated levels recorded in the first half of the year.
- Powersports Business says dealers across the country reported a slight decline of 0.8% in combined same-store sales compared to the same month last year, according to composite data from more than 1,700 dealerships in the U.S. that utilize CDK Lightspeed DMS. On average, dealerships were up 0.2% in major units, but down 6.4% in service and 0.1% in the parts department.
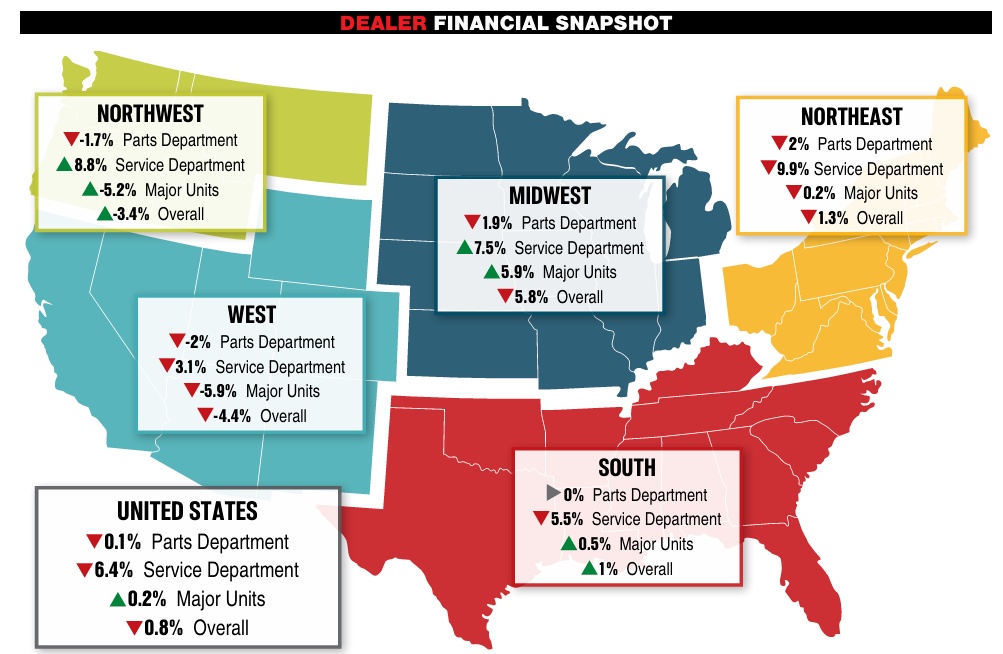 Image Source: Powersports Business