KPI — September: Consumer Trends

Below is a synopsis of relevant consumer-level details, including personal and disposable income, retail impact, consumer confidence and overall consumer sentiment.
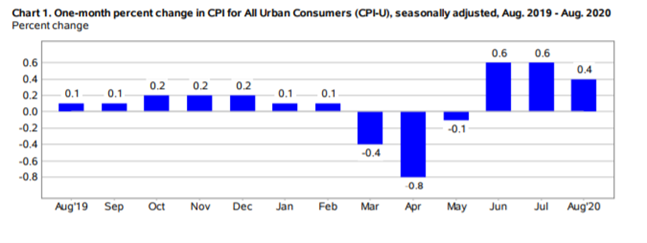
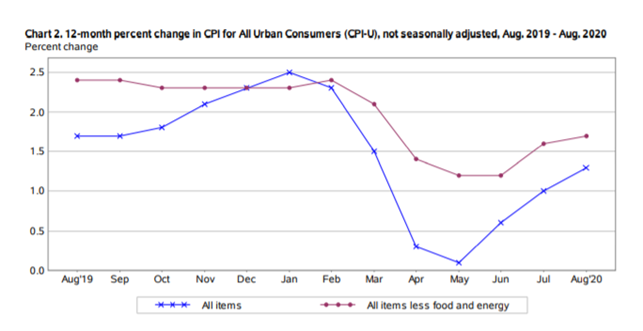
The Consumer Price Index for All Urban Consumers (CPI-U)—which measures the changes in the price of a basket of goods and services purchased by urban consumers—increased 0.4% (on a seasonally adjusted basis) after rising 0.6% in July, reported the U.S. Bureau of Labor Statistics. The all items index increased by 1.3% (before seasonal adjustment) over the last 12 months.
Important takeaways, courtesy of the U.S. Bureau of Labor Statistics
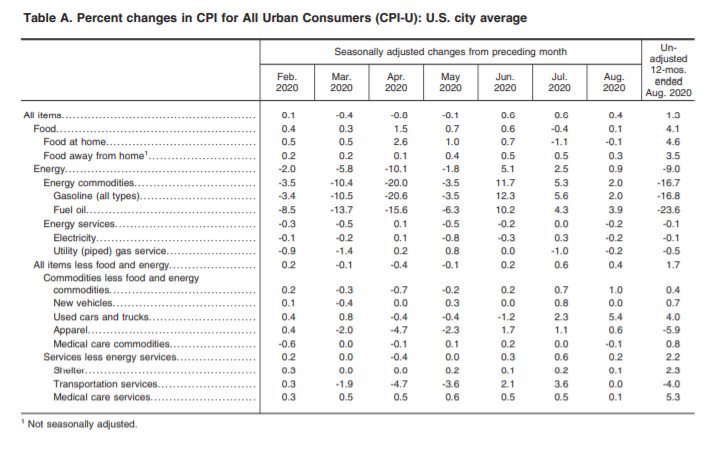
- Energy index increased 0.9%, as the gasoline index rose 2%
- Food index increased 0.1% after falling in July; an increase in the food away from home index more than offset a slight decline in the food at home index
- All items less food and energy index increased 0.4% after increasing 0.6% in July
- Used cars and trucks index accounted for over 40% of the increase
- Indexes for shelter, recreation, household furnishings and operations, apparel, motor vehicle insurance and airline fares also increased
- Education and personal care indexes were among the few to decline
- All items less food and energy index increased 1.7% over the last 12 months
Consumer Sentiment, Consumer Confidence, Consumer Spending
The Consumer Sentiment Index—a survey consisting of approximately 50 core questions that cover consumers’ assessments of their personal financial situation, buying attitudes and overall economic conditions—finished at 74.1 in August. The index is trending up (78.9) in a September preliminary reading by the University of Michigan Survey of Consumers.
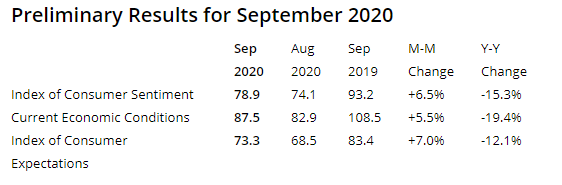
Richard Curtin, chief economist for Surveys of Consumers, noted improved consumer sentiment in early September, even pointing to numbers “reaching the top of the range it has traveled since April.”
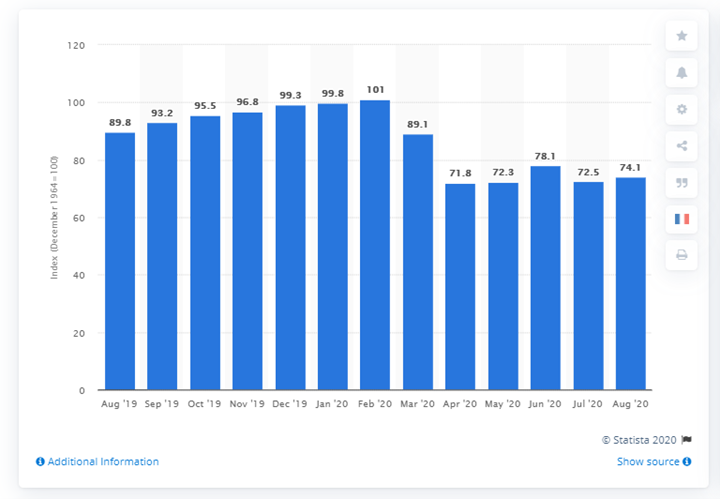
This graphic by Statista shows the U.S. Consumer Sentiment Index from August 2019 to August 2020. The index is normalized to have a value of 100 in December 1964 and based on a monthly survey of consumers, conducted in the continental United States. It consists of about 50 core questions that cover consumers’ assessments of their personal financial situation, their buying attitudes and overall economic conditions. The Consumer Sentiment Index stood at 74.1 in August 2020.
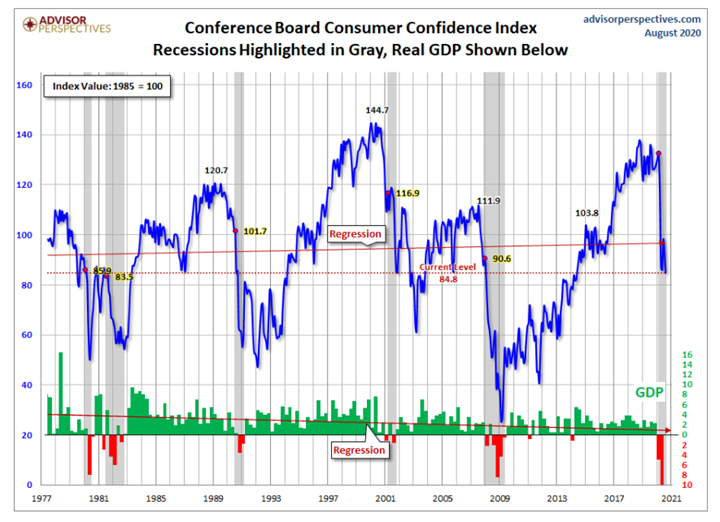
Conversely, the Conference Board Consumer Confidence Index® decreased in August after declining in July. The Index now stands at 84.8 (1985=100), down from 91.7.
“Consumer Confidence declined in August for the second consecutive month,” said Lynn Franco, senior director of economic indicators at The Conference Board. “The Present Situation Index decreased sharply, with consumers stating that both business and employment conditions had deteriorated over the past month. Consumers’ optimism about the short-term outlook, and their financial prospects, also declined and continues on a downward path. Consumer spending has rebounded in recent months but increasing concerns amongst consumers about the economic outlook and their financial well-being will likely cause spending to cool in the months ahead.”
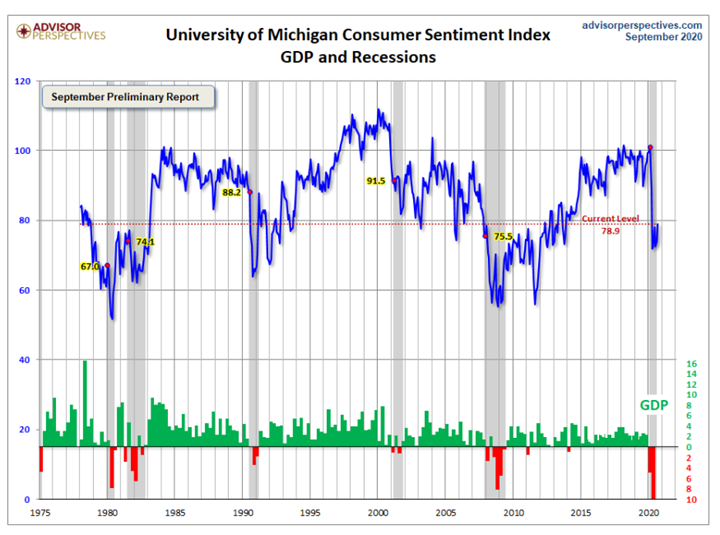
Jill Mislinski of Advisor Perspectives—a leading interactive publisher for Registered Investment Advisors (RIAs), wealth managers and financial advisors—put the recent consumer sentiment report into a larger historical context. Consumer sentiment is 8.5% below the average reading (arithmetic mean) and 7.4% below the geometric mean. The current index level is at the 29th percentile of the 513 monthly data points in this series. Note: This indicator is somewhat volatile, with a 3-point absolute average monthly change. The latest data point saw a 4.8-point increase from the previous month.
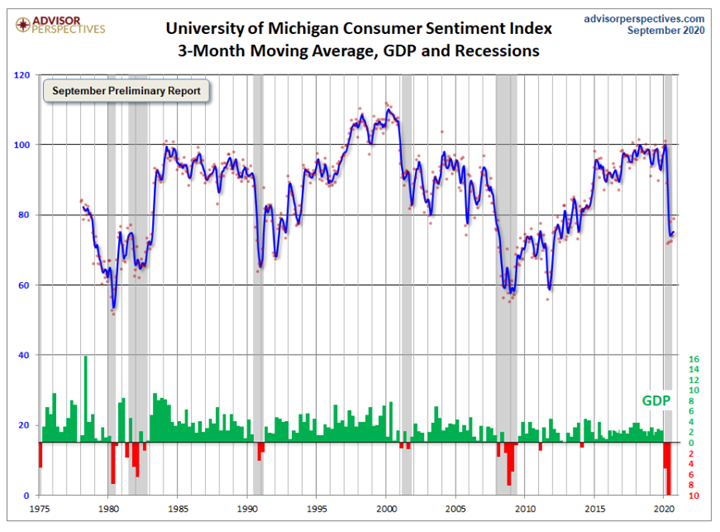
For the sake of comparison, here is a chart of the Conference Board’s Consumer Confidence Index (monthly update here). The Conference Board Index is the more volatile of the two, but the broad pattern and general trends have been remarkably similar to the Michigan Index, said Jill Mislinski of Advisor Perspectives.
And finally, the prevailing mood of the Michigan survey also is similar to the mood of small business owners, as captured by the NFIB Business Optimism Index (monthly update here).
Over the next several months, “There are two factors that could cause volatile shifts and steep losses in consumer confidence: how the election is decided and the delays in obtaining vaccinations. While the end of the recession will depend on these non-economic factors, the hardships endured by consumers can only be offset by renewed federal relief payments,” explained Curtin.
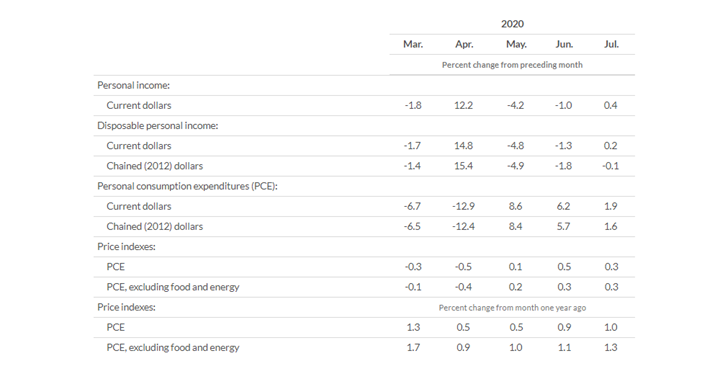
Consumers may be anxious about the upcoming election and finalization of a vaccine, but personal income, disposable income and personal consumption expenditures (PCE) increased $70.5 billion (or .4%), $39.9 billion (or 0.2%) and $267.6 billion (or 1.9%) respectively, according to estimates released by the Bureau of Economic Analysis.
Likewise, consumer confidence may be unsteady, but consumer spending continues to stabilize. Sales of existing homes jumped to 24.7% in July, according to the National Association of Realtors. August housing data from Realtor.com® shows a “hot, late-summer housing market” has pushed home listing prices into double-digit growth territory for the first time since 2017.
- National inventory declined by 36.4% year-over-year, and inventory in large markets decreased by 38.1%.
- The inventory of newly listed properties declined by 11.8% nationally over the past year, and 11.4% in large markets.
- The August national median listing price was $350,000, up 10.1% year-over-year. Prices rose 8.9% in larger markets.
- Nationally, the typical home spent 56 days on the market in August, five days less than the same time last year. In larger markets, the typical home also spent seven days less on the market compared to last year.
Moreover, retail sales posted a gradual improvement over July and larger gains year-over-year, according to the National Retail Federation (NRF).
“While August retail sales numbers were a bit mixed, we believe the consumer is resilient and is in good shape as we head into the holiday season,” said NRF President and CEO Matthew Shay. “Over the past several months, consumers have responded well to federal relief measures that have supported the recovery, so it comes as no surprise that they would take a pause on spending as some of these programs tapered off at the end of July. We continue to advocate for additional stimulus measures to help the economy recover. With the holidays quickly approaching, our retailers are prepared to serve customers to meet all of their holiday needs and are embracing the new holiday tradition of shopping early,” he added.
At this point, said NRF Chief Economist Jack Kleinhenz, “It is difficult to sort out how much economic activity is due to government support and how much is evidence of hardcore demand due to recent job gains. August numbers might have been higher if not for small businesses struggling with reopening and the return to full operations.” To review key retail sector data by category, click here.
Important takeaways, courtesy of NRF
- Following a 0.9% month-over-month increase in July, overall retail sales increased 0.6% (seasonally adjusted) during August; sales are up 2.6% year-over-year.
- NRF’s calculation of retail sales, which excludes automobile dealers, gasoline stations and restaurants in order to focus on core retail, showed a month-over-month increase of 0.1% during August (seasonally adjusted); sales are up 5.6% unadjusted year-over-year. The August NRF numbers build on a 0.6% monthly increase and a 9.6% year-over-year increase in July. NRF’s numbers posted a gain of 8.5% unadjusted year-over-year on a three-month moving average.
- Just over half of retail categories saw month-over-month gains, and two-thirds saw year-over-year increases. The biggest monthly gain came at clothing stores, but their sales remained far below last year.
Consumer spending accounts for approximately two-thirds of the economy. Americans remain hopeful that a bump in consumer sentiment coupled with another record month of housing sales and stabilizing retail will influence more positive results in the months ahead.
Key Performance Indicators Report — September 2020