- KPI – September 2025: State of Business – Automotive Industry
- KPI – September 2025: State of Manufacturing
- KPI – September 2025: State of the Economy
- KPI – September 2025: Consumer Trends
- KPI – September 2025: Recent Vehicle Recalls
With consumer tensions high, confidence and sentiment data are at odds with an increase in Fiserv Small Business Index and NFIB Small Business Optimism Index results. Low monthly job gains, threatening tariffs, fears of economic decline, geopolitical division and war have consumers on edge; however, recent small business data points to resilience and optimism in business conditions. In the months ahead, all eyes are fixated on the economy—measuring job growth, analyzing tariff impacts and monitoring interest rates.
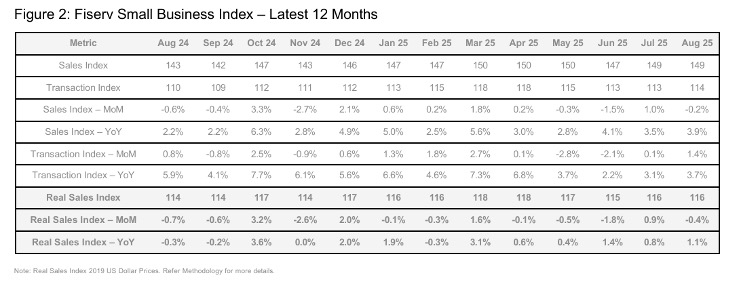
Nationally, the Fiserv Small Business Index registered 148.6 in August, reflecting 3.9% year-over-year growth but a 0.2% month-over-month decline. In addition, the Fiserv Small Business Transaction Index reached 114.1, with transactions increasing 3.7% year-over-year and 1.4% month-over-month. When adjusted for inflation, the Real Fiserv Small Business Index was 115.6, posting 1.1% year-over-year growth but a 0.4% monthly decline. Overall, data suggests steady consumer activity despite slight monthly sales contraction.
“The bottom line: consumers showed up but remain very cautious,” as stated in the report.
Key Takeaways, Courtesy of The Fiserv Small Business Sales Index:
- Sales shifted toward Goods (+0.6%), while Services slipped (-0.5%)—revealing a consumer pivot. Groceries, Gasoline and Clothing led Goods growth, but Professional Services and small contractor services pulled back. Over the year, Services (+4.8%) outpaced Goods (+2%), underscoring the structural strength of Services sectors. Foot traffic followed a similar pattern, and average ticket sizes remained stable, signaling that Services remain the long-term growth engine.
- Discretionary spending rose 1.2% month-over-month, led by quick-service dining and budget-friendly entertainment. Essentials fell 1.5% month-over-month, suggesting consumers are reallocating spend over the short term as summer ends. Necessities continue to dominate spending at small businesses. On an annualized basis, Essentials rose 5.9%—nearly triple Discretionary’s 2% growth. Larger average tickets drove much of Essentials’ gain, with year-over-year growth at 3.1%. In contrast, Discretionary ticket sizes fell 2% year-over-year, reflecting more budget-conscious consumer choices.
- Retail sales growth was steady, up 1.1% month-over-month, with foot traffic up 0.9%. All subsectors experienced sales growth except Health & Personal Care. Food & Beverage led month-over-month growth (+1.7%), but year-over-year inflation-adjusted sales fell -1.4%—continuing a contracting trend that has been observed since April.
- Restaurant sales grew 2.1% month-over-month, fueled by increased foot traffic of 1.8%. Annualized sales growth at Food Services and Drinking Places (restaurants) was up 2.2% due to 3.4% additional foot traffic. “This gain was almost entirely from quick-service restaurants (+8.3%), targeted as fast, affordable and favored by increasingly budget-conscious consumers,” according to the report.
- The Fiserv Small Business Index for Professional, Scientific and Technical Services in the U.S. increased 7.9% year-over-year, while the Real Fiserv Small Business Index year-over-year percentage showed a long-term change of +4.9% in August 2025. In month-over-month terms, the Fiserv Small Business Index for Food Services and Drinking Places rose by 2.1%, with the Real Fiserv Small Business Index month-over-month percentage increasing by 1.8%, showing a short-term trend in August 2025. Meanwhile, the Fiserv Small Business Transaction Index year-over-year percentage for Merchant, Wholesalers and Durable Goods declined by 6%, highlighting foot traffic changes during August 2025.
In August, the NFIB Small Business Optimism Index rose 0.5 points to 100.8, nearly three points above the 52-year average of 98. Of the 10 Optimism Index components, four increased, four decreased and two were unchanged. The increase in business owners expecting real sales to be higher contributed the most to the rise in the Optimism Index. While the Uncertainty Index fell by four points to 93, it remained well above the historical average. According to the report, the decline was due to a decrease in uncertainty about financing expectations and planned capital expenditures.
“Optimism increased slightly in August, with more owners reporting stronger sales expectations and improved earnings,” says Bill Dunkelberg, NFIB chief economist.
Important Takeaways, Courtesy of NFIB:
- Data shows there was a notable improvement in overall business health, with 14% of owners reporting conditions as excellent (up 1%) and 54% reporting them as good (up 2%). Another 27% reported the health of their business as fair (down 4%), while 4% reported poor (unchanged).
- Approximately 21% of small business owners reported labor quality as the single most important problem for their business. It remained a top problem among respondents.
- Approximately 32% (seasonally adjusted) of all owners reported job openings they could not fill in the current period, down 1% month-over-month. The last time unfilled job openings fell below 32% was in July 2020.
- The net percent of owners expecting higher real sales volumes rose 6% to a net 12% (seasonally adjusted). This component contributed the most to the Optimism Index’s increase.
- A net 0% (seasonally adjusted) of owners viewed current inventory stocks as “too low” in August, up 3% month-over-month.
- The net percent of owners raising average selling prices fell 3% to a net 21% (seasonally adjusted), the lowest reading of the year.
- The frequency of reports of positive profit trends improved 3% to a net negative 19% (seasonally adjusted). August’s reading was the best since March 2023.
- The average rate paid on short maturity loans was 8.1%, down 0.6% month-over-month and the lowest reading since May 2023.
- Nearly 23% of all owners reported borrowing on a regular basis, down 2% from July. The last time the percent of business owners borrowing on a regular basis was below 23% was in November 2021.
Professionals in the automotive, RV and powersports industries remain steadfast in their efforts to evolve their business models and grow their brands in the face of adversity. As such, the monthly Key Performance Indicator Report serves as an objective wellness check on the overall health of our nation, from the state of manufacturing and vehicle sales to current economic conditions and consumer trends. Below are a few key data points explained in further detail throughout the report.
Key Data Points:
- Economic activity in the manufacturing sector contracted for the sixth consecutive month, following a two-month expansion preceded by 26 straight months of contraction, say the nation’s supply executives in the latest ISM Manufacturing PMI Report. The Manufacturing PMI registered 48.7% in August, a 0.7% increase compared to the 48% recorded in July.
- The Consumer Price Index for All Urban Consumers (CPI-U) increased 0.4% on a seasonally-adjusted basis after rising 0.2% in July, according to the U.S. Bureau of Labor Statistics. Over the last 12 months, the all-items index increased 2.9% before seasonal adjustment.
- In August, the global light vehicle (LV) selling rate was “broadly in line” with the previous month, registering over 94 million units per year. The market grew 4% year-over-year, as sales reached 7.2 million units globally. In addition, year-to-date sales currently stand at 59 million units, up 5% from the same period in 2024. Total new vehicle sales for September 2025, including retail and non-retail transactions, are projected to reach 1,232,200—a 0.1% year-over-year increase, according to a joint forecast from J.D. Power and GlobalData.
- According to the RV Industry Association’s survey of manufacturers, RV shipments totaled 22,633 units in July, a -6.1% growth rate compared to the 24,116 units shipped in July 2024. Towable RVs, led by conventional travel trailers, were down 8.7% year-over-year with 19,686 shipments. Motorhomes were up 15.3% year-over-year with 2,947 units. Park Model RVs increased 5.7% compared to the same month last year, with 316 wholesale shipments. Year-to-date, RV shipments are up 5.2% with 213,338 units.
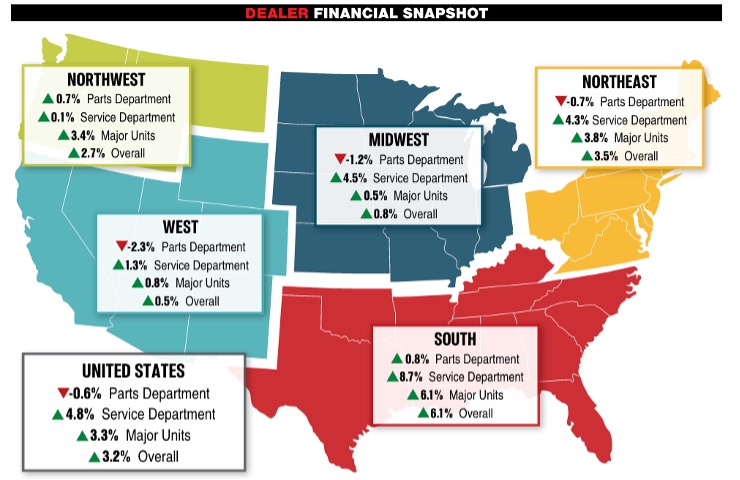
- Powersports Business says dealers across the country reported an overall combined revenue incline of 3.2% year-over-year in July, according to composite data from more than 1,700 dealerships in the U.S. that utilize CDK Lightspeed DMS. On average, dealerships were up 3.3% in major units and 4.8% in service, but down 0.6% in parts.