KPI — September 2023: State of Business
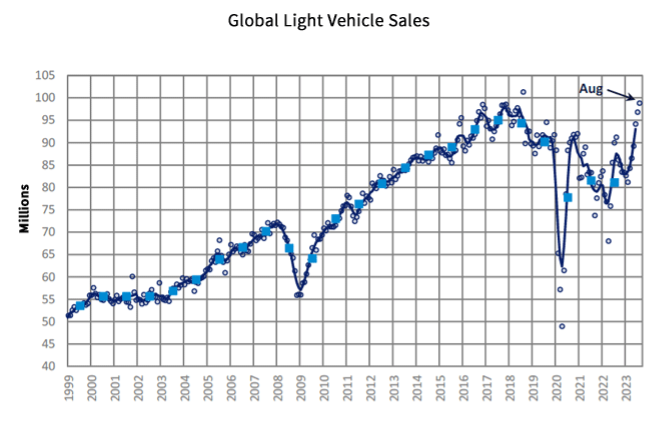
GlobalData reports the global light vehicle (LV) selling rate rose for the sixth consecutive month in August – reaching 99 million units per year, following a revised figure of 97 million units per year in July. Currently, the market is up 9.6% year-over-year, with 57 million units sold year-to-date (YTD).
The U.S., as well as Western and Eastern European countries, all registered double digit year-over-year growth. In part, the spike is due to weak comparative data but GlobalData also points to an alleviation in supply-side issues. In addition, Chinese sales grew 5.2%, driven by “a booming export sector.” Although, the domestic PV market in China fell slightly because of subdued consumer confidence.
“The global automotive market remains resilient and the outlook for 2023 has been increased from 86.4 million units to 86.8 million units, an increase of 7% from 2022,” says Jeff Schuster, group head and executive vice president of automotive at GlobalData. “Supporting this improvement, the effects of production and supply disruption continue to improve. The estimated disruption to volume globally in 2023 has been cut to 3.4 million units from 3.8 million in June – and that is less than half of the disruption of 8.2 million units in 2022.”
Looking ahead, the 2024 forecast for global light vehicles is holding at 90.2 million units.
State of Manufacturing
Economic activity in the manufacturing sector contracted for the 10th consecutive month following a 28-month period of growth, according to the nation’s supply executives in the latest Manufacturing ISM® Report On Business®. While the August Manufacturing PMI® increased slightly to 47.6%, it remains in contraction territory.
“The U.S. manufacturing sector shrank again, but the uptick in the PMI® indicates a slower rate of contraction. The August composite index reading reflects companies managing outputs appropriately as order softness continues, but the month-over-month increase is a sign of improvement,” says Timothy R. Fiore, CPSM, C.P.M., chair of the Institute for Supply Management® (ISM®) Manufacturing Business Survey Committee.
Important takeaways, Courtesy of the Manufacturing ISM® Report On Business®:
- Demand eased again, with the (1) New Orders Index contracting at a slightly faster rate, (2) New Export Orders Index continuing in contraction territory with minimal signs of improvement and (3) Backlog of Orders Index improving for the third straight month but remaining at low levels.
- The Customers’ Inventories Index reading indicated appropriate buyer/supplier tension, which is neutral to slightly positive for future production.
- Output/Consumption(measured by the Production and Employment indexes) was positive, with a combined 5.8-percentage point upward impact on the Manufacturing PMI® Panelists’ companies stabilized production compared to July and continued to manage head counts, primarily through attrition.
- Inputs– defined as supplier deliveries, inventories, prices and imports – continued to accommodate future demand growth.
- The Supplier Deliveries Index indicated faster deliveries for the 11th straight month, and the Inventories Index remained in contraction territory as panelists’ companies continued to mitigate inventories exposure.
- The Prices Index remained in “decreasing” territory but increased a respectable 5.8 percentage points, signifying near price stability. Sentiment improved regarding manufacturing lead times, although they remain at elevated levels.
U.S. New Vehicle Sales
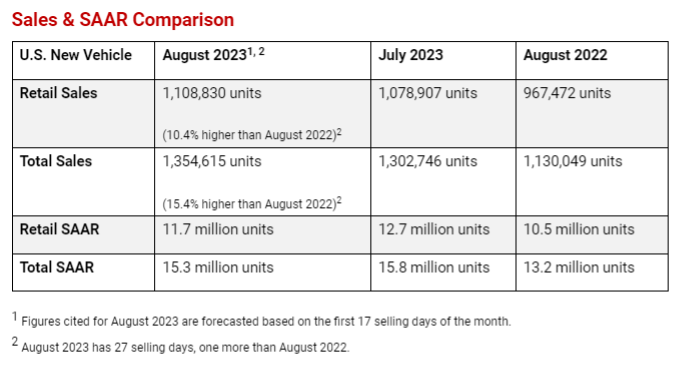
Total new vehicle sales for August 2023, including retail and non-retail transactions, are projected to reach 1,354,600 units – a 15.4% year-over-year increase, according to a joint forecast from J.D. Power and GlobalData.
“August feels like another rinse-and-repeat month as the industry continues its pace of double-digit sales growth for a fifth consecutive month. This is facilitated by incremental increases in vehicle production and leveraging continued strong demand from fleet customers,” says Thomas King, president of the data and analytics division at J.D. Power.
Sales to fleet customers remain elevated, King adds, as manufacturers leverage higher vehicle production to allocate more vehicles to fleet customers. According to J.D. Power, fleet sales are projected to increase 45.6% year-over-year.
Important Takeaways, Courtesy of J.D. Power:
- Retail buyers are on pace to spend $47.8 billion on new vehicles, up $5 billion year-over-year.
- Truck/SUVs account for 78.6% of new vehicle retail sales in August.
- The average new vehicle retail transaction price in August is expected to reach $45,537, down $566 year-over-year.
- Average incentive spending per unit is expected to reach $1,902, up from $953 year-over-year.
- Average interest rates for new vehicle loans are 7.3%, 182 basis points higher than a year ago.
- Total retailer profit per unit, which includes grosses, finance and insurance income, is predicted to reach $3,534 in August.
- Fleet sales are estimated to total 245,785 units in August, up 45.6% year-over-year on a selling day adjusted basis. Fleet volume is expected to account for 18.1% of total light-vehicle sales, up from 14.4% a year ago.
“In September, the main focus will be on any potential work stoppages that could hinder production. A disruption in production could create more asymmetry in the market and potentially extend the overall tight supply situation currently in place. This would give support to new-vehicle pricing, but also keep used-vehicle values high. Thereby trade-in values could remain elevated longer continuing to help consumers offset higher interest rates and pricing,” King says.
U.S. Used Market
Wholesale used-vehicle prices (on a mix-, mileage- and seasonally-adjusted basis) increased 1.5% from August during the first 15 days of September. The mid-month Manheim Used Vehicle Value Index rose to 215.4, which was down 3.5% year-over-year.
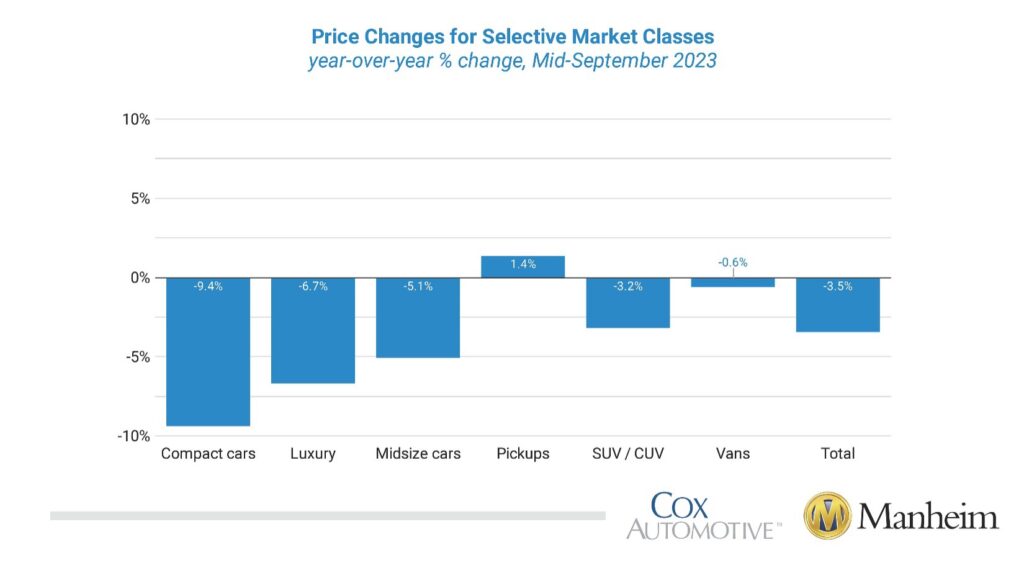
According to Manheim, all major market segments posted seasonally-adjusted prices that were lower year-over-year in the first half of September. Pickups proved to be the exception, which gained 1.4%. Vans and SUVs declined 0.6% and 3.2%, respectively. Compact cars, luxury and midsize cars decreased more than the industry, at 9.4%, 6.7% and 5.1%, respectively. The major segments showed improved price performance compared to August, with all units increasing between 0.7% and 2.9% — except luxury, which dipped 0.5% month-over-month.
Overall, used-vehicle prices declined slightly from a year ago but remain close to all-time highs. J.D. Power says the current average trade-in equity is approximately $9,101, down $780 from a year ago. For context, trade-in equity this month is still double the pre-pandemic level, helping owners offset some of the pricing and interest rate increases.
KPI — September 2023: Recent Vehicle Recalls
Key Performance Indicators Report — September 2023


