KPI — September 2023: Consumer Trends

The Conference Board Consumer Confidence Index® declined significantly to 106.1 (1985=100) in August, following a downwardly revised 114.0 in July. The Present Situation Index – based on consumers’ assessment of current business and labor market conditions – fell to 144.8 (1985=100) from 153.0. The Expectations Index – based on consumers’ short-term outlook for income, business and labor market conditions – declined to 80.2 (1985=100), reversing July’s sharp uptick to 88.0. Historically, expectations hovering around 80 indicate a recession within the next year.
“Consumer confidence fell in August 2023, erasing back-to-back increases in June and July,” says Dana Peterson, chief economist at The Conference Board. “August’s disappointing headline number reflected dips in both the current conditions and expectations indexes. Write-in responses showed that consumers were once again preoccupied with rising prices in general, and for groceries and gasoline in particular.”
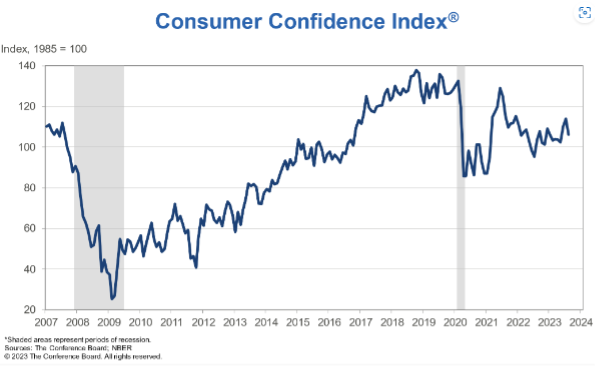
According to recent data, the pullback in consumer confidence was evident across all age groups – most notably among consumers with household incomes of $100,000 or more, as well as those earning less than $50,000. Confidence held relatively steady for consumers with incomes between $50,000 and $99,999.
Peterson says the proportion of consumers saying recession is “somewhat” or “very likely” ticked down in August but remains elevated at 69%. She notes mixed buying plans among consumers, with auto and appliance purchases trending upward and homebuying ticking downward.
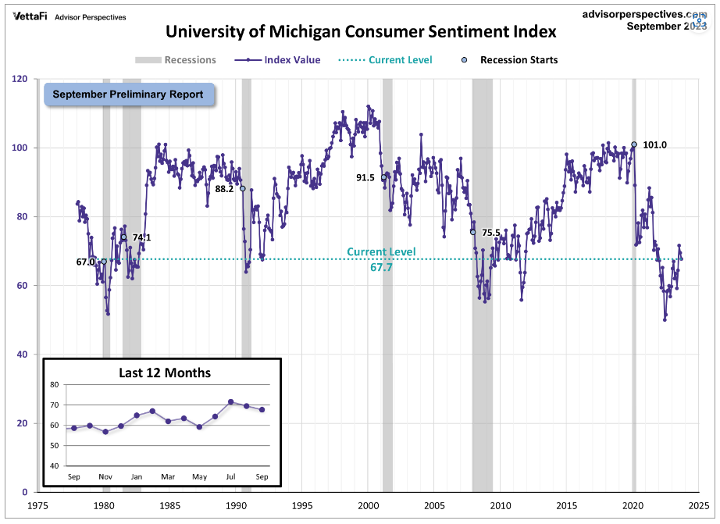
The chart evaluates the historical context for this index as a coincident indicator of the economy. Toward this end, Advisor Perspectives highlighted recessions and included GDP. To put today’s report into the larger historical context since its beginning in 1978, consumer sentiment is 20.4% below its average reading (arithmetic mean) of 85.1 and 19.4% below its geometric mean of 84.0. The current index level is at the 14th percentile of the 549 monthly data points in this series. This indicator is somewhat volatile, with a 3.1-point absolute average monthly change. The latest data point saw a 1.8-point decrease from the previous month.
Similarly, the University of Michigan Survey of Consumers – a survey consisting of approximately 50 core questions covering consumers’ assessments of their personal financial situation, buying attitudes and overall economic conditions – dipped to 69.5 in August, with September preliminary data currently registering 67.7.
Important Takeaways, Courtesy of Survey of Consumers:
- Year-ahead inflation expectations moderated from 3.5% to 3.1% this month. The current reading is the lowest since March 2021 and is slightly above the 2.3-3.0% range seen in the two years prior to the pandemic.
- Long-run inflation expectations came in at 2.7%, falling below the narrow 2.9-3.1% range for only the second time in the last 26 months. In comparison, long-run inflation expectations ranged between 2.2% and 2.6% in the two years pre-pandemic.
Consumer Income & Spending
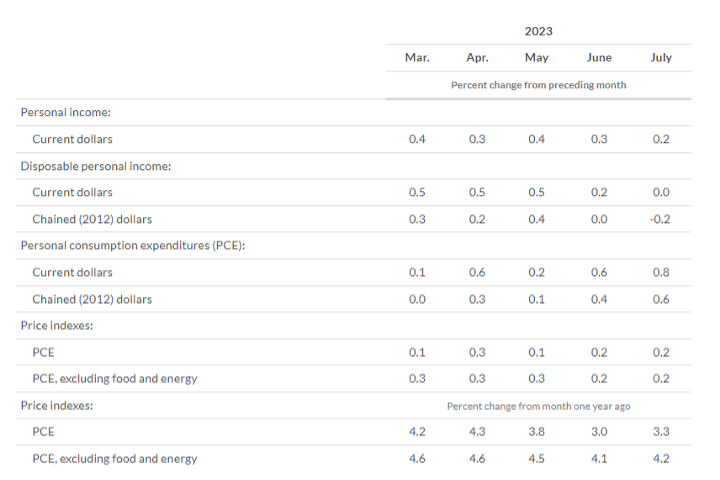
According to the U.S. Bureau of Economic Analysis (BEA), in July 2023 personal income increased $45 billion (0.2% at a monthly rate), while disposable personal income (DPI) – personal income less personal current taxes – increased $7.3 billion (less than 0.1%) and personal consumption expenditures (PCE) increased $144.6 billion (0.8%).
In addition, personal outlays – the sum of PCE, personal interest payments and personal current transfer payments – increased $153.8 billion. Personal saving was $705.6 billion in July and the personal saving rate –personal saving as a percentage of disposable personal income – registered 3.5%.
Important Takeaways, Courtesy of BEA:
- In July, the 0.6% increase in real PCE reflected an increase of 0.9% in spending on goods and an increase of 0.4% on services. Within goods, the largest contributors to the increase were “other” nondurable goods (led by games, toys and hobbies), as well as recreational goods and vehicles (led by video, audio, photographic and information processing equipment and media). Within services, the largest contributors to the increase were food services and accommodations (led by food services), financial services and insurance (led by portfolio management and investment advice services), plus housing and utilities (led by utilities).
- The PCE price index in July increased 3.3%. Prices for goods decreased 0.5%, while prices for services increased 5.2%. While food prices increased 3.5%, energy prices decreased 14.6%. Excluding food and energy, the PCE price index increased 4.2% year-over-year.
Key Performance Indicators Report — September 2023


