KPI — September 2022: Consumer Trends
The Conference Board Consumer Confidence Index® increased in August, following three consecutive monthly declines. The Index now stands at 103.2 (1985=100), up from 95.3 in July. The Present Situation Index – based on consumers’ assessment of current business and labor market conditions – improved to 145.4 from 139.7 last month. The Expectations Index – based on consumers’ short-term outlook for income, business and labor market conditions – increased to 75.1 from 65.6.
The Present Situation Index recorded a gain for the first time since March, according to the most recent report. In addition, the Expectations Index also improved from July’s nine-year low. Though, its below-80 reading suggests recession risks are heightened, says Lynn Franco, senior director of economic indicators at The Conference Board.
Despite uncertainty, Franco notes purchasing intentions increased after a July pullback and vacation intentions reached an eight-month high. Looking ahead, she says August’s improvement in confidence may help support spending, but inflation and additional rate hikes still pose risks to economic growth in the short term.
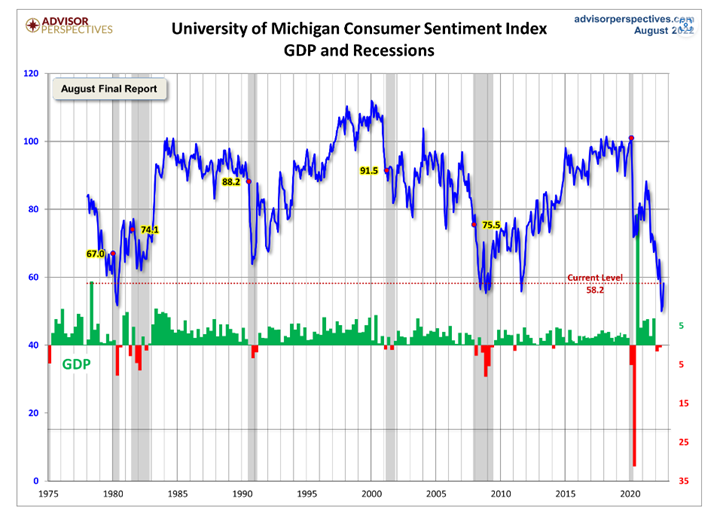
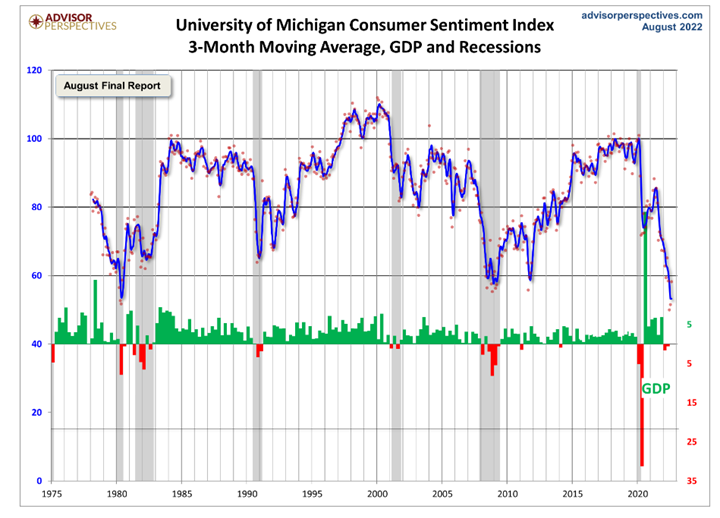
The chart evaluates the historical context for this index as a coincident indicator of the economy. Toward this end, Advisor Perspectives highlighted recessions and included GDP. To put the current report into larger historical context since its beginning in 1978, consumer sentiment is 32% below the average reading (arithmetic mean) and 31.2% below the geometric mean. The current index level is at the 2nd percentile of the 536 monthly data points in this series. Note that this indicator is somewhat volatile, with a three-point absolute average monthly change. The latest data point saw a 6.7-point increase from the previous month.
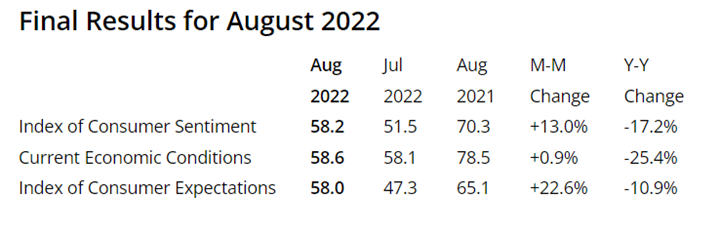
The Consumer Sentiment Index – a survey consisting of approximately 50 core questions covering consumers’ assessments of their personal financial situation, buying attitudes and overall economic conditions – increased slightly from 51.5 in July to 58.2 in August, rising 13% month-over-month but down 17% year-over-year, according to the University of Michigan Survey of Consumers.
Important Takeaways from Survey of Consumers:
- Most of the increase was concentrated in expectations, with a 59% surge in the year-ahead outlook for the economy following two months at its lowest reading since the Great Recession.
- In addition, personal financial expectations rose 12% since July. The gains in sentiment were seen across age, education, income, region and political affiliation, and can be attributed to the recent deceleration in inflation. (Such data is contradictory to more current readings, as noted in various sections throughout The SHOP’s KPI report.)
- Lower-income consumers, who have fewer resources to buffer against inflation, posted particularly large gains on all index components. Their sentiment now exceeds that of higher-income consumers, when it typically lags higher-income sentiment by over 15 points.
- The median expected year-ahead inflation rate was 4.8%, down from 5.2% last month and its lowest reading in eight months. Though uncertainty over expectations rose considerably, particularly among lower-educated consumers. Long run expectations came in at 2.9%, remaining within the 2.9-3.1% range seen in the past year.
According to Pew Research, seven-in-ten Americans view inflation as “a very big problem for the country,” followed by the affordability of health care and violent crime. A recent Gallup poll further supports the assessment, with approximately 56% of U.S. households reporting economic stress due to inflation – up from 49% in January and 45% in November. The findings, according to CNBC, indicate runaway inflation is eating into the bedrock of the American economy – the middle-class – and even eroding the financial stability of more well-heeled households. Gallup says one-in-four consumers noted cutbacks on spending to cope with inflation, while almost 20% point to paring costs by canceling vacations and driving less. With consumer spending accounting for approximately 70 cents on every $1 dollar of economic activity, inflation could have detrimental impacts.
Consumer Income & Spending
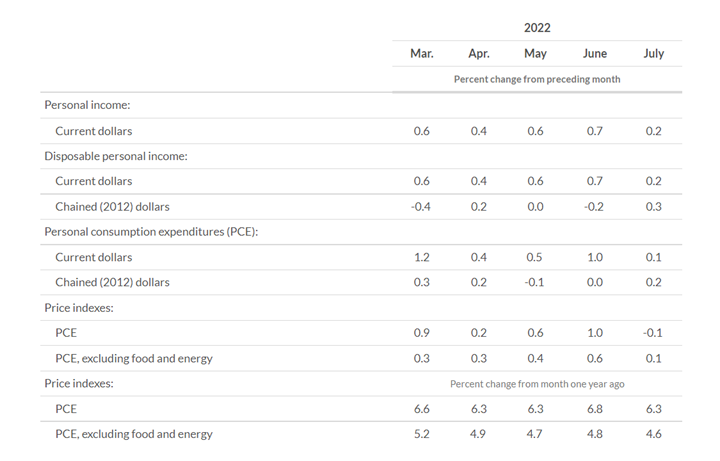
According to the U.S. Bureau of Economic Analysis (BEA), personal income increased $47 billion (0.2%) in July. Disposable personal income (DPI) increased $37.6 billion (0.2%) and personal consumption expenditures (PCE) increased $23.7 billion (0.1%). Real DPI increased 0.3% in July and real PCE increased 0.2%, while goods and services each increased 0.2%.
Important Takeaways, Courtesy of BEA:
- The $23.7 billion increase in current-dollar PCE in July reflected an increase of $33.3 billion in spending for services partly offset by a decrease of $9.6 billion in spending for goods.
- Within services, the largest contributors to the increase were spending for housing and utilities (mainly housing) and for “other” services (mainly international travel). Within goods, gasoline and other energy goods was the leading contributor to the decrease.
- Personal outlays increased $27 billion in July. Personal saving was $932.3 billion, while the personal saving rate – personal saving as a percentage of disposable personal income – hit 5%.
- The PCE price index increased 6.3% year-over-year. Prices for goods increased 9.5% and 4.6% for services. Food prices increased 11.9% and energy prices 34.4%. Excluding food and energy, the PCE price index increased 4.6% year-over-year.
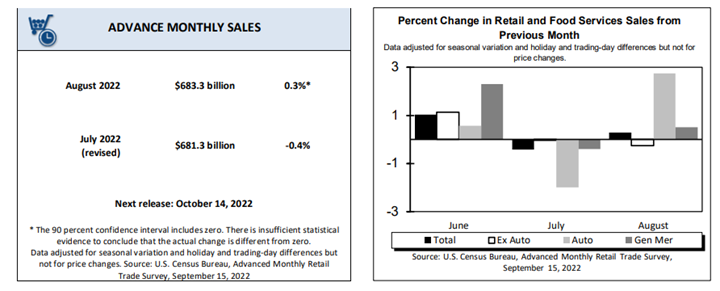
Advance estimates of U.S. retail and food services sales for August 2022 – adjusted for seasonal variation, holiday and trading-day differences but not for price changes – were $683.3 billion, an increase of 0.3% (±0.5%)* month-over-month and 9.1% (±0.7%) year-over-year. Total sales for the June 2022 through August 2022 period were up 9.3% (±0.5%) from the same period a year ago. The June 2022 to July 2022 percent change was revised from virtually unchanged (±0.5%)* to down 0.4% (±0.2%). Retail trade sales were up 0.2% (±0.4%)* from July 2022 and up 8.9% (±0.7%) above last year. Gasoline stations were up 29.3% (±1.6%) year-over-year, while non-store retailers were up 11.2% (±1.2%) from last year.
Key Performance Indicators Report — September 2022


